|
1200
|
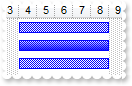
Is it possible to display the task bars with a gradient color
Dim oG2antt as P
Dim var_Bar as P
Dim var_Chart as P
Dim var_Items as P

oG2antt = topparent:CONTROL_ACTIVEX1.activex
oG2antt.BeginUpdate()
var_Chart = oG2antt.Chart
	var_Chart.FirstVisibleDate = {12/31/2009}
	var_Chart.LevelCount = 2
	' var_Chart.PaneWidth(.f.) = 96
	oG2antt.TemplateDef = "dim var_Chart"
	oG2antt.TemplateDef = var_Chart
	oG2antt.Template = "var_Chart.PaneWidth(False) = 96"

	var_Chart.Bars.Copy("Task","TaskO")
	var_Bar = var_Chart.Bars.Item("Task")
		var_Bar.Pattern = 99 'exPatternGradientVBox + exPatternBox + exPatternShadow
		var_Bar.StartColor = 16777215
		var_Bar.EndColor = var_Bar.Color
oG2antt.Columns.Add("Types")
var_Items = oG2antt.Items
	var_Items.AddBar(var_Items.AddItem("Original"),"TaskO",{01/04/2010},{01/09/2010},"")
	var_Items.AddBar(var_Items.AddItem("Pattern Gradient"),"Task",{01/04/2010},{01/09/2010},"")
	var_Items.AddBar(var_Items.AddItem("Original"),"TaskO",{01/04/2010},{01/09/2010},"")
oG2antt.EndUpdate()
|
|
1199
|
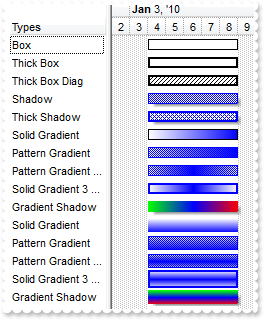
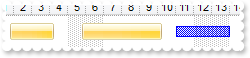
How can I know the type of bars I can displays using predefined patterns
Dim oG2antt as P
Dim var_Bar as local
Dim var_Bar1 as local
Dim var_Bar10 as P
Dim var_Bar11 as P
Dim var_Bar12 as P
Dim var_Bar13 as P
Dim var_Bar14 as P
Dim var_Bar2 as local
Dim var_Bar3 as local
Dim var_Bar4 as local
Dim var_Bar5 as P
Dim var_Bar6 as P
Dim var_Bar7 as P
Dim var_Bar8 as P
Dim var_Bar9 as P
Dim var_Bars as P
Dim var_Chart as P
Dim var_Items as P

oG2antt = topparent:CONTROL_ACTIVEX1.activex
oG2antt.BeginUpdate()
var_Chart = oG2antt.Chart
	var_Chart.FirstVisibleDate = {12/31/2009}
	var_Chart.LevelCount = 2
	' var_Chart.PaneWidth(.f.) = 96
	oG2antt.TemplateDef = "dim var_Chart"
	oG2antt.TemplateDef = var_Chart
	oG2antt.Template = "var_Chart.PaneWidth(False) = 96"

	var_Bars = var_Chart.Bars
		' var_Bars.Add("Box").Pattern = 32
		var_Bar = var_Bars.Add("Box")
		oG2antt.TemplateDef = "dim var_Bar"
		oG2antt.TemplateDef = var_Bar
		oG2antt.Template = "var_Bar.Pattern = 32"

		' var_Bars.Add("ThickBox").Pattern = 4128 'exPatternThickBox + exPatternBox
		var_Bar1 = var_Bars.Add("ThickBox")
		oG2antt.TemplateDef = "dim var_Bar1"
		oG2antt.TemplateDef = var_Bar1
		oG2antt.Template = "var_Bar1.Pattern = 4128"

		' var_Bars.Add("DiagBox").Pattern = 4102 'exPatternThickBox + exPatternBDiagonal
		var_Bar2 = var_Bars.Add("DiagBox")
		oG2antt.TemplateDef = "dim var_Bar2"
		oG2antt.TemplateDef = var_Bar2
		oG2antt.Template = "var_Bar2.Pattern = 4102"

		' var_Bars.Copy("Task","Shadow").Pattern = 8195 'exPatternFrameShadow + exPatternShadow
		var_Bar3 = var_Bars.Copy("Task","Shadow")
		oG2antt.TemplateDef = "dim var_Bar3"
		oG2antt.TemplateDef = var_Bar3
		oG2antt.Template = "var_Bar3.Pattern = 8195"

		' var_Bars.Copy("Task","TShadow").Pattern = 12295 'exPatternFrameShadow + exPatternThickBox + exPatternDiagCross
		var_Bar4 = var_Bars.Copy("Task","TShadow")
		oG2antt.TemplateDef = "dim var_Bar4"
		oG2antt.TemplateDef = var_Bar4
		oG2antt.Template = "var_Bar4.Pattern = 12295"

		var_Bar5 = var_Bars.Add("HGrad1")
			var_Bar5.Pattern = 32
			var_Bar5.StartColor = 16777215
			var_Bar5.EndColor = 16711680
		var_Bar6 = var_Bars.Add("HGrad2")
			var_Bar6.Pattern = 35 'exPatternBox + exPatternShadow
			var_Bar6.StartColor = 16777215
			var_Bar6.EndColor = 16711680
			var_Bar6.Color = 16711680
		var_Bar7 = var_Bars.Add("HGrad3")
			var_Bar7.Pattern = 163 'exPatternGradient3Colors + exPatternBox + exPatternShadow
			var_Bar7.StartColor = 16777215
			var_Bar7.EndColor = var_Bar7.StartColor
			var_Bar7.Color = 16711680
		var_Bar8 = var_Bars.Add("HGrad4")
			var_Bar8.Pattern = 4256 'exPatternThickBox + exPatternGradient3Colors + exPatternBox
			var_Bar8.StartColor = 16777215
			var_Bar8.EndColor = var_Bar8.StartColor
			var_Bar8.Color = 16711680
		var_Bar9 = var_Bars.Add("HGrad5")
			var_Bar9.Pattern = 8352 'exPatternFrameShadow + exPatternGradient3Colors + exPatternBox
			var_Bar9.StartColor = 65280
			var_Bar9.EndColor = 255
			var_Bar9.Color = 16711680
		var_Bar10 = var_Bars.Add("VGrad1")
			var_Bar10.Pattern = 96 'exPatternGradientVBox + exPatternBox
			var_Bar10.StartColor = 16777215
			var_Bar10.EndColor = 16711680
			var_Bar10.Height = 14
		var_Bar11 = var_Bars.Add("VGrad2")
			var_Bar11.Pattern = 99 'exPatternGradientVBox + exPatternBox + exPatternShadow
			var_Bar11.StartColor = 16777215
			var_Bar11.EndColor = 16711680
			var_Bar11.Color = 16711680
			var_Bar11.Height = 14
		var_Bar12 = var_Bars.Add("VGrad3")
			var_Bar12.Pattern = 227 'exPatternGradient3Colors + exPatternGradientVBox + exPatternBox + exPatternShadow
			var_Bar12.StartColor = 16777215
			var_Bar12.EndColor = var_Bar12.StartColor
			var_Bar12.Color = 16711680
			var_Bar12.Height = 14
		var_Bar13 = var_Bars.Add("VGrad4")
			var_Bar13.Pattern = 4320 'exPatternThickBox + exPatternGradient3Colors + exPatternGradientVBox + exPatternBox
			var_Bar13.StartColor = 16777215
			var_Bar13.EndColor = var_Bar13.StartColor
			var_Bar13.Color = 16711680
			var_Bar13.Height = -1
		var_Bar14 = var_Bars.Add("VGrad5")
			var_Bar14.Pattern = 8416 'exPatternFrameShadow + exPatternGradient3Colors + exPatternGradientVBox + exPatternBox
			var_Bar14.StartColor = 65280
			var_Bar14.EndColor = 255
			var_Bar14.Color = 16711680
			var_Bar14.Height = 14
oG2antt.Columns.Add("Types")
var_Items = oG2antt.Items
	var_Items.AddBar(var_Items.AddItem("Box"),"Box",{01/04/2010},{01/09/2010},"")
	var_Items.AddBar(var_Items.AddItem("Thick Box"),"ThickBox",{01/04/2010},{01/09/2010},"")
	var_Items.AddBar(var_Items.AddItem("Thick Box Diag"),"DiagBox",{01/04/2010},{01/09/2010},"")
	var_Items.AddBar(var_Items.AddItem("Shadow"),"Shadow",{01/04/2010},{01/09/2010},"")
	var_Items.AddBar(var_Items.AddItem("Thick Shadow"),"TShadow",{01/04/2010},{01/09/2010},"")
	var_Items.AddBar(var_Items.AddItem("Solid Gradient"),"HGrad1",{01/04/2010},{01/09/2010},"")
	var_Items.AddBar(var_Items.AddItem("Pattern Gradient"),"HGrad2",{01/04/2010},{01/09/2010},"")
	var_Items.AddBar(var_Items.AddItem("Pattern Gradient 3 Colors"),"HGrad3",{01/04/2010},{01/09/2010},"")
	var_Items.AddBar(var_Items.AddItem("Solid Gradient 3 Colors"),"HGrad4",{01/04/2010},{01/09/2010},"")
	var_Items.AddBar(var_Items.AddItem("Gradient Shadow"),"HGrad5",{01/04/2010},{01/09/2010},"")
	var_Items.AddBar(var_Items.AddItem("Solid Gradient"),"VGrad1",{01/04/2010},{01/09/2010},"")
	var_Items.AddBar(var_Items.AddItem("Pattern Gradient"),"VGrad2",{01/04/2010},{01/09/2010},"")
	var_Items.AddBar(var_Items.AddItem("Pattern Gradient 3 Colors"),"VGrad3",{01/04/2010},{01/09/2010},"")
	var_Items.AddBar(var_Items.AddItem("Solid Gradient 3 Colors"),"VGrad4",{01/04/2010},{01/09/2010},"")
	var_Items.AddBar(var_Items.AddItem("Gradient Shadow"),"VGrad5",{01/04/2010},{01/09/2010},"")
oG2antt.EndUpdate()
|
|
1198
|
Is it possible to display the bars with a thicker border

Dim oG2antt as P
Dim var_Bar as local
Dim var_Chart as local
Dim var_Items as P

oG2antt = topparent:CONTROL_ACTIVEX1.activex
oG2antt.BeginUpdate()
oG2antt.Columns.Add("Task")
oG2antt.Chart.FirstVisibleDate = {01/01/2001}
' oG2antt.Chart.PaneWidth(.f.) = 48
var_Chart = oG2antt.Chart
oG2antt.TemplateDef = "dim var_Chart"
oG2antt.TemplateDef = var_Chart
oG2antt.Template = "var_Chart.PaneWidth(False) = 48"

' oG2antt.Chart.Bars.Copy("Task","TaskB").Pattern = 4099 'exPatternThickBox + exPatternShadow
var_Bar = oG2antt.Chart.Bars.Copy("Task","TaskB")
oG2antt.TemplateDef = "dim var_Bar"
oG2antt.TemplateDef = var_Bar
oG2antt.Template = "var_Bar.Pattern = 4099"

var_Items = oG2antt.Items
	var_Items.AddBar(var_Items.AddItem("Task 1"),"Task",{01/02/2001},{01/05/2001},"")
	var_Items.AddBar(var_Items.AddItem("Task 2"),"TaskB",{01/02/2001},{01/05/2001},"")
	var_Items.AddBar(var_Items.AddItem("Task 3"),"Task",{01/02/2001},{01/05/2001},"")
oG2antt.EndUpdate()
|
|
1197
|
Is it possible to display the shadow for EBN bars

Dim oG2antt as P
Dim var_Bar as P
Dim var_Bar1 as local
Dim var_Chart as local
Dim var_Items as P

oG2antt = topparent:CONTROL_ACTIVEX1.activex
oG2antt.BeginUpdate()
oG2antt.VisualAppearance.Add(1,"c:\exontrol\images\normal.ebn")
oG2antt.Columns.Add("Task")
oG2antt.Chart.FirstVisibleDate = {01/01/2001}
' oG2antt.Chart.PaneWidth(.f.) = 48
var_Chart = oG2antt.Chart
oG2antt.TemplateDef = "dim var_Chart"
oG2antt.TemplateDef = var_Chart
oG2antt.Template = "var_Chart.PaneWidth(False) = 48"

var_Bar = oG2antt.Chart.Bars.Copy("Task","EBN")
	var_Bar.Color = 16777216
	var_Bar.Pattern = 8192
' oG2antt.Chart.Bars.Copy("Task","EBN2").Color = 16777216
var_Bar1 = oG2antt.Chart.Bars.Copy("Task","EBN2")
oG2antt.TemplateDef = "dim var_Bar1"
oG2antt.TemplateDef = var_Bar1
oG2antt.Template = "var_Bar1.Color = 16777216"

var_Items = oG2antt.Items
	var_Items.AddBar(var_Items.AddItem("Task 1"),"EBN2",{01/02/2001},{01/05/2001},"")
	var_Items.AddBar(var_Items.AddItem("Task 2"),"EBN",{01/02/2001},{01/05/2001},"")
	var_Items.AddBar(var_Items.AddItem("Task 3"),"EBN2",{01/02/2001},{01/05/2001},"")
oG2antt.EndUpdate()
|
|
1196
|
Can I display a shadow for my bars

Dim oG2antt as P
Dim var_Chart as local
Dim var_Items as P

oG2antt = topparent:CONTROL_ACTIVEX1.activex
oG2antt.BeginUpdate()
oG2antt.Columns.Add("Task")
oG2antt.Chart.FirstVisibleDate = {01/01/2001}
' oG2antt.Chart.PaneWidth(.f.) = 48
var_Chart = oG2antt.Chart
oG2antt.TemplateDef = "dim var_Chart"
oG2antt.TemplateDef = var_Chart
oG2antt.Template = "var_Chart.PaneWidth(False) = 48"

oG2antt.Chart.Bars.Item("Task").Pattern = 8195 'exPatternFrameShadow + exPatternShadow
var_Items = oG2antt.Items
	var_Items.AddBar(var_Items.AddItem("Task 1"),"Task",{01/02/2001},{01/05/2001},"")
	var_Items.AddBar(var_Items.AddItem("Task 2"),"Task",{01/02/2001},{01/05/2001},"")
oG2antt.EndUpdate()
|
|
1195
|
How can I use the Color property for gradient bars

Dim oG2antt as P
Dim var_Bar as P
Dim var_Bar1 as P
Dim var_Chart as local
Dim var_Items as P

oG2antt = topparent:CONTROL_ACTIVEX1.activex
oG2antt.BeginUpdate()
oG2antt.Columns.Add("Task")
oG2antt.Chart.FirstVisibleDate = {01/01/2001}
' oG2antt.Chart.PaneWidth(.f.) = 48
var_Chart = oG2antt.Chart
oG2antt.TemplateDef = "dim var_Chart"
oG2antt.TemplateDef = var_Chart
oG2antt.Template = "var_Chart.PaneWidth(False) = 48"

var_Bar = oG2antt.Chart.Bars.Add("V")
	var_Bar.Color = 255
	var_Bar.StartColor = 65280
	var_Bar.EndColor = var_Bar.StartColor
	var_Bar.Pattern = 224 'exPatternGradient3Colors + exPatternGradientVBox + exPatternBox
	var_Bar.Height = -1
var_Bar1 = oG2antt.Chart.Bars.Add("H")
	var_Bar1.Color = 255
	var_Bar1.StartColor = 65280
	var_Bar1.EndColor = var_Bar1.StartColor
	var_Bar1.Pattern = 160 'exPatternGradient3Colors + exPatternBox
var_Items = oG2antt.Items
	var_Items.AddBar(var_Items.AddItem("Task 1"),"V",{01/02/2001},{01/05/2001},"")
	var_Items.AddBar(var_Items.AddItem("Task 2"),"H",{01/02/2001},{01/05/2001},"")
oG2antt.EndUpdate()
|
|
1194
|
Is there any option to show bars with vertical gradient

Dim h as N
Dim oG2antt as P
Dim var_Bar as P
Dim var_Items as P

oG2antt = topparent:CONTROL_ACTIVEX1.activex
oG2antt.Columns.Add("Task")
oG2antt.Chart.FirstVisibleDate = {01/01/2001}
var_Bar = oG2antt.Chart.Bars.Item("Task")
	var_Bar.Color = 255
	var_Bar.StartColor = 65280
	var_Bar.EndColor = 65535
	var_Bar.Pattern = 96 'exPatternGradientVBox + exPatternBox
var_Items = oG2antt.Items
	h = var_Items.AddItem("Task")
	var_Items.AddBar(h,"Task",{01/02/2001},{01/05/2001},"")
|
|
1193
|
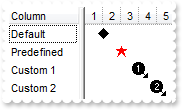
How can I define a new milestone bar
Dim oG2antt as P
Dim var_Bar as local
Dim var_Bar1 as local
Dim var_Bar2 as P
Dim var_Bars as P
Dim var_Items as P

oG2antt = topparent:CONTROL_ACTIVEX1.activex
oG2antt.BeginUpdate()
oG2antt.Images("gBJJgBAIDAAGAAEAAQhYAf8Pf4hh0QihCJo2AEZjQAjEZFEaIEaEEaAIAkcbk0olUrlktl0vmExmUzmk1m03nE5nU7nk9n0/oFBoVDolFo1HpFJpVLplNp1PqFRqVTqlVq1XrFZrVbrldr1fsFhsVjslls1ntFptVrtltt1vuFxuVzul1u13vF5vV7vl9v1/wGBwWDwmFw2HxGJxWLxmNx0xiFdyOTh8Tf9ZymXx+QytcyNgz8r0OblWjyWds+m0ka1Vf1ta1+r1mos2xrG2xeZ0+a0W0qOx3GO4NV3WeyvD2XJ5XL5nN51aiw+lfSj0gkUkAEllHanHI5j/cHg8EZf7w8vl8j4f/qfEZeB09/vjLAB30+kZQAP/P5/H6/yNAOAEAwCjMBwFAEDwJBMDwLBYAP2/8Hv8/gAGAD8LQs9w/nhDY/oygIA=")
oG2antt.Chart.FirstVisibleDate = {01/01/2001}
var_Bars = oG2antt.Chart.Bars
	var_Bars.AddShapeCorner(12345,1)
	var_Bars.AddShapeCorner(12346,2)
	' var_Bars.Copy("Milestone","M1").StartShape = 12345 '3020 + exShapeIconVBar + exShapeIconRight
	var_Bar = var_Bars.Copy("Milestone","M1")
	oG2antt.TemplateDef = "dim var_Bar"
	oG2antt.TemplateDef = var_Bar
	oG2antt.Template = "var_Bar.StartShape = 12345"

	' var_Bars.Copy("Milestone","M2").StartShape = 12346 '3020 + exShapeIconSquare + exShapeIconRight
	var_Bar1 = var_Bars.Copy("Milestone","M2")
	oG2antt.TemplateDef = "dim var_Bar1"
	oG2antt.TemplateDef = var_Bar1
	oG2antt.Template = "var_Bar1.StartShape = 12346"

	var_Bar2 = var_Bars.Copy("Milestone","MP")
		var_Bar2.StartShape = 20
		var_Bar2.StartColor = 255
oG2antt.Columns.Add("Column")
var_Items = oG2antt.Items
	var_Items.AddBar(var_Items.AddItem("Default"),"Milestone",{01/02/2001},{01/02/2001})
	var_Items.AddBar(var_Items.AddItem("Predefined"),"MP",{01/03/2001},{01/03/2001})
	var_Items.AddBar(var_Items.AddItem("Custom 1"),"M1",{01/04/2001},{01/04/2001})
	var_Items.AddBar(var_Items.AddItem("Custom 2"),"M2",{01/05/2001},{01/05/2001})
oG2antt.EndUpdate()
|
|
1192
|
How can I define my milestone bar, using my icons or pictures
Dim oG2antt as P
Dim var_Bar as local
Dim var_Bars as P
Dim var_Items as P

oG2antt = topparent:CONTROL_ACTIVEX1.activex
oG2antt.Images("gBJJgBAIDAAGAAEAAQhYAf8Pf4hh0QihCJo2AEZjQAjEZFEaIEaEEaAIAkcbk0olUrlktl0vmExmUzmk1m03nE5nU7nk9n0/oFBoVDolFo1HpFJpVLplNp1PqFRqVTqlVq1XrFZrVbrldr1fsFhsVjslls1ntFptVrtltt1vuFxuVzul1u13vF5vV7vl9v1/wGBwWDwmFw2HxGJxWLxmNx0xiFdyOTh8Tf9ZymXx+QytcyNgz8r0OblWjyWds+m0ka1Vf1ta1+r1mos2xrG2xeZ0+a0W0qOx3GO4NV3WeyvD2XJ5XL5nN51aiw+lfSj0gkUkAEllHanHI5j/cHg8EZf7w8vl8j4f/qfEZeB09/vjLAB30+kZQAP/P5/H6/yNAOAEAwCjMBwFAEDwJBMDwLBYAP2/8Hv8/gAGAD8LQs9w/nhDY/oygIA=")
oG2antt.Chart.FirstVisibleDate = {01/01/2001}
var_Bars = oG2antt.Chart.Bars
	var_Bars.AddShapeCorner(12345,1)
	' var_Bars.Item("Milestone").StartShape = 12345 '3020 + exShapeIconVBar + exShapeIconRight
	var_Bar = var_Bars.Item("Milestone")
	oG2antt.TemplateDef = "dim var_Bar"
	oG2antt.TemplateDef = var_Bar
	oG2antt.Template = "var_Bar.StartShape = 12345"

oG2antt.Columns.Add("Column")
var_Items = oG2antt.Items
	var_Items.AddBar(var_Items.AddItem("Item 1"),"Milestone",{01/02/2001},{01/02/2001})
|
|
1191
|
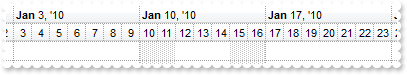
Is it possible to specify manually non-working days instead using the NonworkingDays as being repetitive
Dim oG2antt as P
Dim var_Chart as P
Dim var_Level as local

oG2antt = topparent:CONTROL_ACTIVEX1.activex
oG2antt.BeginUpdate()
var_Chart = oG2antt.Chart
	var_Chart.DrawGridLines = -1
	var_Chart.FirstVisibleDate = {01/01/2010}
	' var_Chart.PaneWidth(.f.) = 0
	oG2antt.TemplateDef = "dim var_Chart"
	oG2antt.TemplateDef = var_Chart
	oG2antt.Template = "var_Chart.PaneWidth(0) = 0"

	var_Chart.LevelCount = 2
	' var_Chart.Level(0).DrawGridLines = .t.
	var_Level = var_Chart.Level(0)
	oG2antt.TemplateDef = "dim var_Level"
	oG2antt.TemplateDef = var_Level
	oG2antt.Template = "var_Level.DrawGridLines = True"

	var_Chart.ShowNonworkingUnits = .f.
	var_Chart.ShowNonworkingDates = .f.
	var_Chart.NonworkingDays = 0
	var_Chart.AddNonworkingDate({01/10/2010})
	var_Chart.AddNonworkingDate({01/11/2010})
	var_Chart.AddNonworkingDate({01/15/2010})
	var_Chart.AddNonworkingDate({01/16/2010})
oG2antt.EndUpdate()
|
|
1190
|
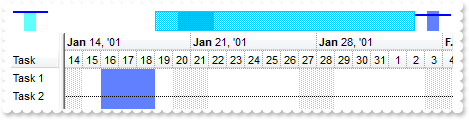
Is it possible to hide specific days
Dim oG2antt as P
Dim var_Chart as P
Dim var_Level as local

oG2antt = topparent:CONTROL_ACTIVEX1.activex
oG2antt.BeginUpdate()
var_Chart = oG2antt.Chart
	var_Chart.DrawGridLines = -1
	var_Chart.FirstVisibleDate = {01/01/2010}
	' var_Chart.PaneWidth(.f.) = 0
	oG2antt.TemplateDef = "dim var_Chart"
	oG2antt.TemplateDef = var_Chart
	oG2antt.Template = "var_Chart.PaneWidth(0) = 0"

	var_Chart.LevelCount = 2
	' var_Chart.Level(0).DrawGridLines = .t.
	var_Level = var_Chart.Level(0)
	oG2antt.TemplateDef = "dim var_Level"
	oG2antt.TemplateDef = var_Level
	oG2antt.Template = "var_Level.DrawGridLines = True"

	var_Chart.ShowNonworkingUnits = .f.
	var_Chart.ShowNonworkingDates = .f.
	var_Chart.NonworkingDays = 128
	var_Chart.AddNonworkingDate({01/10/2010})
	var_Chart.AddNonworkingDate({01/11/2010})
	var_Chart.AddNonworkingDate({01/15/2010})
	var_Chart.AddNonworkingDate({01/16/2010})
oG2antt.EndUpdate()
|
|
1189
|
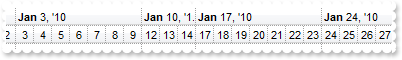
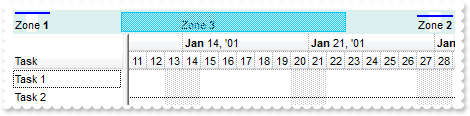
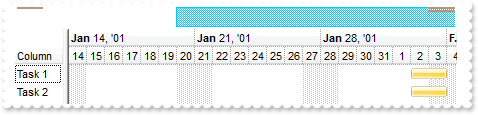
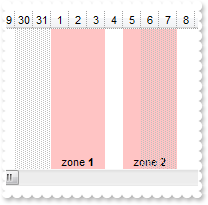
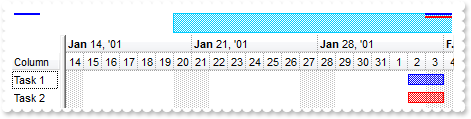
Is it possible to show or display the marked zones ONLY in the overview part of the control
Dim h1 as N
Dim h2 as N
Dim oG2antt as P
Dim var_Chart as P
Dim var_Items as P

oG2antt = topparent:CONTROL_ACTIVEX1.activex
oG2antt.BeginUpdate()
oG2antt.Columns.Add("Task")
var_Chart = oG2antt.Chart
	var_Chart.LevelCount = 2
	var_Chart.FirstVisibleDate = {01/14/2001}
	' var_Chart.PaneWidth(.f.) = 48
	oG2antt.TemplateDef = "dim var_Chart"
	oG2antt.TemplateDef = var_Chart
	oG2antt.Template = "var_Chart.PaneWidth(False) = 48"

	var_Chart.AllowLinkBars = .f.
	var_Chart.AllowCreateBar = 0
	var_Chart.OverviewVisible = 2
	var_Chart.Bars.Item("Task").Pattern = 1
	var_Chart.MarkTimeZone("Z1",{01/03/2001},{01/04/2001},var_Chart.BackColor,";;Zone <b>1</b>")
	var_Chart.MarkTimeZone("Z2",{02/06/2001},{02/07/2001},var_Chart.BackColor,";;Zone <b>2</b>")
	var_Chart.MarkTimeZone("Z3",{01/16/2001},{01/19/2001},var_Chart.BackColor,";;Zone <b>3</b>")
	var_Chart.OverviewShowMarkTimeZones = .t.
	var_Chart.OverviewBackColor = 15790300
var_Items = oG2antt.Items
	h1 = var_Items.AddItem("Task 1")
	var_Items.AddBar(h1,"Task",{01/02/2001},{01/05/2001},"K1")
	h2 = var_Items.AddItem("Task 2")
	var_Items.AddBar(h2,"Task",{02/05/2001},{02/08/2001},"K2")
	var_Items.AddLink("L1",h1,"K1",h2,"K2")
oG2antt.EndUpdate()
|
|
1188
|
Is it possible to show or display the marked zones in the overview part of the control
Dim h1 as N
Dim h2 as N
Dim oG2antt as P
Dim var_Chart as P
Dim var_Items as P

oG2antt = topparent:CONTROL_ACTIVEX1.activex
oG2antt.BeginUpdate()
oG2antt.Columns.Add("Task")
var_Chart = oG2antt.Chart
	var_Chart.LevelCount = 2
	var_Chart.FirstVisibleDate = {01/14/2001}
	' var_Chart.PaneWidth(.f.) = 48
	oG2antt.TemplateDef = "dim var_Chart"
	oG2antt.TemplateDef = var_Chart
	oG2antt.Template = "var_Chart.PaneWidth(False) = 48"

	var_Chart.AllowLinkBars = .f.
	var_Chart.AllowCreateBar = 0
	var_Chart.OverviewVisible = 2
	var_Chart.Bars.Item("Task").Pattern = 1
	var_Chart.MarkTimeZone("Z1",{01/03/2001},{01/04/2001},16777056)
	var_Chart.MarkTimeZone("Z2",{02/06/2001},{02/07/2001},16744544)
	var_Chart.MarkTimeZone("Z3",{01/16/2001},{01/19/2001},16744544)
	var_Chart.OverviewShowMarkTimeZones = .t.
var_Items = oG2antt.Items
	h1 = var_Items.AddItem("Task 1")
	var_Items.AddBar(h1,"Task",{01/02/2001},{01/05/2001},"K1")
	h2 = var_Items.AddItem("Task 2")
	var_Items.AddBar(h2,"Task",{02/05/2001},{02/08/2001},"K2")
	var_Items.AddLink("L1",h1,"K1",h2,"K2")
oG2antt.EndUpdate()
|
|
1187
|
Is there a quick way to determine if a bar belongs to a group
Dim h1 as N
Dim h2 as N
Dim h3 as N
Dim oG2antt as P
Dim var_Chart as P
Dim var_Items as P

oG2antt = topparent:CONTROL_ACTIVEX1.activex
oG2antt.Columns.Add("Task")
var_Chart = oG2antt.Chart
	var_Chart.FirstVisibleDate = {01/01/2001}
	' var_Chart.PaneWidth(.f.) = 64
	oG2antt.TemplateDef = "dim var_Chart"
	oG2antt.TemplateDef = var_Chart
	oG2antt.Template = "var_Chart.PaneWidth(False) = 64"

var_Items = oG2antt.Items
	h1 = var_Items.AddItem("Task 1")
	var_Items.AddBar(h1,"Task",{01/02/2001},{01/04/2001},"K1")
	h2 = var_Items.AddItem("Task 2")
	var_Items.AddBar(h2,"Task",{01/05/2001},{01/07/2001},"K2")
	h3 = var_Items.AddItem("Task 3")
	var_Items.AddBar(h3,"Task",{01/05/2001},{01/07/2001},"K3")
	var_Items.GroupBars(h1,"K1",.t.,h2,"K2",.t.)
	var_Items.GroupBars(h1,"K1",.f.,h2,"K2",.f.)
	var_Items.GroupBars(h1,"K1",.t.,h3,"K3",.t.)
	var_Items.GroupBars(h1,"K1",.f.,h3,"K3",.f.)
	? var_Items.ItemBar(h1,"K1",522)
|
|
1186
|
I am using the ScrollRange property to limit the chart's visible area, but it does not work as expected. What could be wrong
Dim oG2antt as P
Dim var_Chart as P

oG2antt = topparent:CONTROL_ACTIVEX1.activex
oG2antt.BeginUpdate()
oG2antt.Columns.Add("Task")
var_Chart = oG2antt.Chart
	var_Chart.LevelCount = 2
	' var_Chart.PaneWidth(.f.) = 56
	oG2antt.TemplateDef = "dim var_Chart"
	oG2antt.TemplateDef = var_Chart
	oG2antt.Template = "var_Chart.PaneWidth(0) = 56"

	' var_Chart.ScrollRange(0) = {01/01/0100}
	oG2antt.TemplateDef = "dim var_Chart"
	oG2antt.TemplateDef = var_Chart
	oG2antt.Template = "var_Chart.ScrollRange(0) = #1/1/100#"

	' var_Chart.ScrollRange(1) = {12/31/9999}
	oG2antt.TemplateDef = "dim var_Chart"
	oG2antt.TemplateDef = var_Chart
	oG2antt.Template = "var_Chart.ScrollRange(1) = #12/31/9999#"

	var_Chart.FirstVisibleDate = {04/28/2010}
oG2antt.Template = "ScrollPartCaption(2,512) = Chart.ScrollRange(0)" // oG2antt.ScrollPartCaption(2,512) = oG2antt.Chart.ScrollRange(0)
oG2antt.Template = "ScrollPartCaptionAlignment(2,512) = 0" // oG2antt.ScrollPartCaptionAlignment(2,512) = 0
oG2antt.Template = "ScrollPartCaption(2,128) = Chart.ScrollRange(1)" // oG2antt.ScrollPartCaption(2,128) = oG2antt.Chart.ScrollRange(1)
oG2antt.Template = "ScrollPartCaptionAlignment(2,128) = 2" // oG2antt.ScrollPartCaptionAlignment(2,128) = 2
oG2antt.EndUpdate()
|
|
1185
|
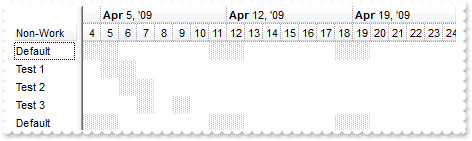
Are you planning to add a AddNonworkingDate / AddNonworkingDay for separate items
Dim oG2antt as P
Dim var_Chart as P
Dim var_Items as P

oG2antt = topparent:CONTROL_ACTIVEX1.activex
oG2antt.BeginUpdate()
oG2antt.AllowChartScrollPage = .t.
oG2antt.Columns.Add("Non-Work")
var_Chart = oG2antt.Chart
	var_Chart.FirstVisibleDate = {04/04/2009}
	' var_Chart.PaneWidth(.f.) = 52
	oG2antt.TemplateDef = "dim var_Chart"
	oG2antt.TemplateDef = var_Chart
	oG2antt.Template = "var_Chart.PaneWidth(False) = 52"

	var_Chart.LevelCount = 2
var_Items = oG2antt.Items
	var_Items.AddItem("Default")
	' var_Items.ItemNonworkingUnits(var_Items.AddItem("Test 1"),.f.) = "shortdate(value) in (#4/5/2009#,#4/6/2009#)"
	oG2antt.TemplateDef = "dim var_Items"
	oG2antt.TemplateDef = var_Items
	oG2antt.Template = "var_Items.ItemNonworkingUnits(AddItem(`Test 1`),False) = `shortdate(value) in (#4/5/2009#,#4/6/2009#)`"

	' var_Items.ItemNonworkingUnits(var_Items.AddItem("Test 2"),.f.) = "shortdate(value) in (#4/6/2009#,#4/7/2009#)"
	oG2antt.TemplateDef = "dim var_Items"
	oG2antt.TemplateDef = var_Items
	oG2antt.Template = "var_Items.ItemNonworkingUnits(AddItem(`Test 2`),False) = `shortdate(value) in (#4/6/2009#,#4/7/2009#)`"

	' var_Items.ItemNonworkingUnits(var_Items.AddItem("Test 3"),.f.) = "shortdate(value) in (#4/7/2009#,#4/9/2009#)"
	oG2antt.TemplateDef = "dim var_Items"
	oG2antt.TemplateDef = var_Items
	oG2antt.Template = "var_Items.ItemNonworkingUnits(AddItem(`Test 3`),False) = `shortdate(value) in (#4/7/2009#,#4/9/2009#)`"

	var_Items.AddItem("Default")
oG2antt.EndUpdate()
|
|
1184
|
How can I enlarge the EBN being applied to an object
Dim h as N
Dim oG2antt as P
Dim var_Appearance as P
Dim var_Chart as P
Dim var_Items as P

oG2antt = topparent:CONTROL_ACTIVEX1.activex
oG2antt.BeginUpdate()
oG2antt.DefaultItemHeight = 32
var_Appearance = oG2antt.VisualAppearance
	var_Appearance.Add(2,"c:\exontrol\images\normal.ebn")
	var_Appearance.Add(1,"CP:2 -3 -2 3 2")
var_Chart = oG2antt.Chart
	var_Chart.FirstVisibleDate = {01/01/2002}
	var_Chart.SelBarColor = 16777216
	' var_Chart.PaneWidth(.f.) = 48
	oG2antt.TemplateDef = "dim var_Chart"
	oG2antt.TemplateDef = var_Chart
	oG2antt.Template = "var_Chart.PaneWidth(0) = 48"

oG2antt.Columns.Add("Task")
var_Items = oG2antt.Items
	h = var_Items.AddItem("Task 1")
	var_Items.AddBar(h,"Task",{01/02/2002},{01/04/2002},"A")
	var_Items.AddBar(h,"Task",{01/06/2002},{01/10/2002},"B")
	var_Items.AddBar(h,"Task",{01/11/2002},{01/14/2002},"C")
	' var_Items.ItemBar(h,"A",257) = .t.
	oG2antt.TemplateDef = "dim var_Items,h"
	oG2antt.TemplateDef = var_Items
	oG2antt.TemplateDef = h
	oG2antt.Template = "var_Items.ItemBar(h,`A`,257) = True"

	' var_Items.ItemBar(h,"B",257) = .t.
	oG2antt.TemplateDef = "dim var_Items,h"
	oG2antt.TemplateDef = var_Items
	oG2antt.TemplateDef = h
	oG2antt.Template = "var_Items.ItemBar(h,`B`,257) = True"

oG2antt.EndUpdate()
|
|
1183
|
I am using EBN to display my bars but the bars shows in black in the overview area. Is there any option to specify a different color in the overview part of the control
Dim h as N
Dim oG2antt as P
Dim var_Chart as P
Dim var_Items as P

oG2antt = topparent:CONTROL_ACTIVEX1.activex
oG2antt.BeginUpdate()
oG2antt.VisualAppearance.Add(1,"c:\exontrol\images\normal.ebn")
var_Chart = oG2antt.Chart
	var_Chart.Bars.Item("Task").Color = 16777216
	' var_Chart.PaneWidth(.f.) = 48
	oG2antt.TemplateDef = "dim var_Chart"
	oG2antt.TemplateDef = var_Chart
	oG2antt.Template = "var_Chart.PaneWidth(False) = 48"

	var_Chart.OverviewVisible = 2
	var_Chart.FirstVisibleDate = {01/11/2001}
	var_Chart.LevelCount = 2
oG2antt.Columns.Add("Column")
var_Items = oG2antt.Items
	h = var_Items.AddItem("Task 1")
	var_Items.AddBar(h,"Task",{01/02/2001},{01/04/2001},1)
	' var_Items.ItemBar(h,1,41) = 8821418
	oG2antt.TemplateDef = "dim var_Items,h"
	oG2antt.TemplateDef = var_Items
	oG2antt.TemplateDef = h
	oG2antt.Template = "var_Items.ItemBar(h,1,41) = 8821418"

	var_Items.AddBar(h,"Task",{02/02/2001},{02/04/2001},2)
	' var_Items.ItemBar(h,2,41) = 8821418
	oG2antt.TemplateDef = "dim var_Items,h"
	oG2antt.TemplateDef = var_Items
	oG2antt.TemplateDef = h
	oG2antt.Template = "var_Items.ItemBar(h,2,41) = 8821418"

	h = var_Items.AddItem("Task 2")
	var_Items.AddBar(h,"Task",{02/02/2001},{02/04/2001},"")
	' var_Items.ItemBar(h,"",41) = 8821418
	oG2antt.TemplateDef = "dim var_Items,h"
	oG2antt.TemplateDef = var_Items
	oG2antt.TemplateDef = h
	oG2antt.Template = "var_Items.ItemBar(h,``,41) = 8821418"

oG2antt.EndUpdate()
|
|
1182
|
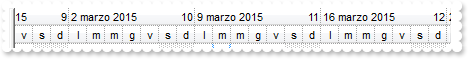
I haven't found options to localize (in Italian) the strings ( dates, tooltip ) that shows in the chart area
Dim oG2antt as P
Dim var_Chart as P
oG2antt = topparent:CONTROL_ACTIVEX1.activex
oG2antt.BeginUpdate()
var_Chart = oG2antt.Chart
var_Chart.LevelCount = 2
' var_Chart.PaneWidth(.f.) = 0
oG2antt.TemplateDef = "dim var_Chart"
oG2antt.TemplateDef = var_Chart
oG2antt.Template = "var_Chart.PaneWidth(False) = 0"
' var_Chart.Label(256) = "<|><%ww%><|><%d%> <%m3%> '<%yy%><r><%ww%><|><%d%> <%mmmm%> <%yyyy%><r><%ww%><||><||>256"
oG2antt.TemplateDef = "dim var_Chart"
oG2antt.TemplateDef = var_Chart
oG2antt.Template = "var_Chart.Label(256) = `<|><%ww%><|><%d%> <%m3%> '<%yy%><r><%ww%><|><%d%> <%mmmm%> <%yyyy%><r><%ww%><||><||>256`"
' var_Chart.Label(4096) = "<|><%d1%><|><%d2%><|><%d3%><|><%dddd%><|><%d3%> <%d%> <%m3%> '<%yy%><|><%dddd%> <%d%> <%mmmm%> <%yyyy%><||><||>4096"
oG2antt.TemplateDef = "dim var_Chart"
oG2antt.TemplateDef = var_Chart
oG2antt.Template = "var_Chart.Label(4096) = `<|><%d1%><|><%d2%><|><%d3%><|><%dddd%><|><%d3%> <%d%> <%m3%> '<%yy%><|><%dddd%> <%d%> <%mmmm%> <%yyyy%><||><||>4096`"
' var_Chart.LabelToolTip(256) = "<%d%> <%mmmm%> <%yyyy%> <%ww%>"
oG2antt.TemplateDef = "dim var_Chart"
oG2antt.TemplateDef = var_Chart
oG2antt.Template = "var_Chart.LabelToolTip(256) = `<%d%> <%mmmm%> <%yyyy%> <%ww%>`"
' var_Chart.LabelToolTip(4096) = "<%dddd%> <%d%> <%mmmm%> <%yyyy%>"
oG2antt.TemplateDef = "dim var_Chart"
oG2antt.TemplateDef = var_Chart
oG2antt.Template = "var_Chart.LabelToolTip(4096) = `<%dddd%> <%d%> <%mmmm%> <%yyyy%>`"
var_Chart.FirstWeekDay = 1
var_Chart.MonthNames = "gennaio febbraio marzo aprile maggio giugno luglio agosto settembre ottobre novembre dicembre"
var_Chart.WeekDays = "domenica luned� marted� mercoled� gioved� venerd� sabato"
var_Chart.ToolTip = "<%dddd%> <%d%> <%mmmm%> <%yyyy%>"
var_Chart.UnitScale = 4096
oG2antt.EndUpdate()
|
|
1181
|
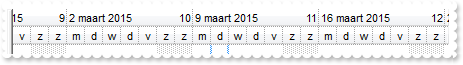
I haven't found options to localize (in Dutch) the strings ( dates, tooltip ) that shows in the chart area
Dim oG2antt as P
Dim var_Chart as P

oG2antt = topparent:CONTROL_ACTIVEX1.activex
oG2antt.BeginUpdate()
var_Chart = oG2antt.Chart
	var_Chart.LevelCount = 2
	' var_Chart.PaneWidth(.f.) = 0
	oG2antt.TemplateDef = "dim var_Chart"
	oG2antt.TemplateDef = var_Chart
	oG2antt.Template = "var_Chart.PaneWidth(False) = 0"

	' var_Chart.Label(256) = "<|><%ww%><|><%d%> <%m3%> '<%yy%><r><%ww%><|><%d%> <%mmmm%> <%yyyy%><r><%ww%><||><||>256"
	oG2antt.TemplateDef = "dim var_Chart"
	oG2antt.TemplateDef = var_Chart
	oG2antt.Template = "var_Chart.Label(256) = `<|><%ww%><|><%d%> <%m3%> '<%yy%><r><%ww%><|><%d%> <%mmmm%> <%yyyy%><r><%ww%><||><||>256`"

	' var_Chart.Label(4096) = "<|><%d1%><|><%d2%><|><%d3%><|><%dddd%><|><%d3%> <%d%> <%m3%> '<%yy%><|><%dddd%> <%d%> <%mmmm%> <%yyyy%><||><||>4096"
	oG2antt.TemplateDef = "dim var_Chart"
	oG2antt.TemplateDef = var_Chart
	oG2antt.Template = "var_Chart.Label(4096) = `<|><%d1%><|><%d2%><|><%d3%><|><%dddd%><|><%d3%> <%d%> <%m3%> '<%yy%><|><%dddd%> <%d%> <%mmmm%> <%yyyy%><||><||>4096`"

	' var_Chart.LabelToolTip(256) = "<%d%> <%mmmm%> <%yyyy%> <%ww%>"
	oG2antt.TemplateDef = "dim var_Chart"
	oG2antt.TemplateDef = var_Chart
	oG2antt.Template = "var_Chart.LabelToolTip(256) = `<%d%> <%mmmm%> <%yyyy%> <%ww%>`"

	' var_Chart.LabelToolTip(4096) = "<%dddd%> <%d%> <%mmmm%> <%yyyy%>"
	oG2antt.TemplateDef = "dim var_Chart"
	oG2antt.TemplateDef = var_Chart
	oG2antt.Template = "var_Chart.LabelToolTip(4096) = `<%dddd%> <%d%> <%mmmm%> <%yyyy%>`"

	var_Chart.FirstWeekDay = 1
	var_Chart.MonthNames = "januari februari maart april mei juni juli augusts september oktober november december"
	var_Chart.WeekDays = "zondag maandag dinsdag woensdag donderdag vrijdag zaterdag"
	var_Chart.ToolTip = "<%dddd%> <%d%> <%mmmm%> <%yyyy%>"
	var_Chart.UnitScale = 4096
oG2antt.EndUpdate()
|
|
1180
|
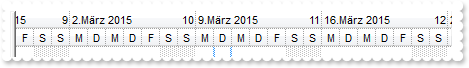
I haven't found options to localize (in German) the strings ( dates, tooltip ) that shows in the chart area (method 1)
Dim oG2antt as P
Dim var_Chart as P
oG2antt = topparent:CONTROL_ACTIVEX1.activex
oG2antt.BeginUpdate()
var_Chart = oG2antt.Chart
var_Chart.LevelCount = 2
' var_Chart.PaneWidth(.f.) = 0
oG2antt.TemplateDef = "dim var_Chart"
oG2antt.TemplateDef = var_Chart
oG2antt.Template = "var_Chart.PaneWidth(False) = 0"
' var_Chart.Label(256) = "<|><%ww%><|><%d%> <%m3%> '<%yy%><r><%ww%><|><%d%>.<%mmmm%> <%yyyy%><r><%ww%><||><||>256"
oG2antt.TemplateDef = "dim var_Chart"
oG2antt.TemplateDef = var_Chart
oG2antt.Template = "var_Chart.Label(256) = `<|><%ww%><|><%d%> <%m3%> '<%yy%><r><%ww%><|><%d%>.<%mmmm%> <%yyyy%><r><%ww%><||><||>256`"
' var_Chart.Label(4096) = "<|><%d1%><|><%d2%><|><%d3%><|><%dddd%><|><%d3%> <%d%>.<%m3%> '<%yy%><|><%dddd%> <%d%>.<%mmmm%> <%yyyy%><||><||>4096"
oG2antt.TemplateDef = "dim var_Chart"
oG2antt.TemplateDef = var_Chart
oG2antt.Template = "var_Chart.Label(4096) = `<|><%d1%><|><%d2%><|><%d3%><|><%dddd%><|><%d3%> <%d%>.<%m3%> '<%yy%><|><%dddd%> <%d%>.<%mmmm%> <%yyyy%><||><||>4096`"
' var_Chart.LabelToolTip(256) = "<%d%>.<%mmmm%> <%yyyy%> <%ww%>"
oG2antt.TemplateDef = "dim var_Chart"
oG2antt.TemplateDef = var_Chart
oG2antt.Template = "var_Chart.LabelToolTip(256) = `<%d%>.<%mmmm%> <%yyyy%> <%ww%>`"
' var_Chart.LabelToolTip(4096) = "<%dddd%>, <%d%>.<%mmmm%> <%yyyy%>"
oG2antt.TemplateDef = "dim var_Chart"
oG2antt.TemplateDef = var_Chart
oG2antt.Template = "var_Chart.LabelToolTip(4096) = `<%dddd%>, <%d%>.<%mmmm%> <%yyyy%>`"
var_Chart.FirstWeekDay = 1
var_Chart.MonthNames = "Januar Februar M�rz April Mai Juni Juli August September Oktober November Dezember"
var_Chart.WeekDays = "Sonntag Montag Dienstag Mittwoch Donnerstag Freitag Samstag"
var_Chart.ToolTip = "<%dddd%>,<%d%>.<%mmmm%> <%yyyy%>"
var_Chart.UnitScale = 4096
oG2antt.EndUpdate()
|
|
1179
|
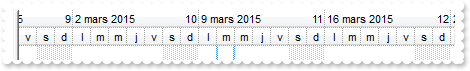
I haven't found options to localize (in French) the strings ( dates, tooltip ) that shows in the chart area
Dim oG2antt as P
Dim var_Chart as P
oG2antt = topparent:CONTROL_ACTIVEX1.activex
oG2antt.BeginUpdate()
var_Chart = oG2antt.Chart
var_Chart.LevelCount = 2
' var_Chart.PaneWidth(.f.) = 0
oG2antt.TemplateDef = "dim var_Chart"
oG2antt.TemplateDef = var_Chart
oG2antt.Template = "var_Chart.PaneWidth(False) = 0"
' var_Chart.Label(256) = "<|><%ww%><|><%d%> <%m3%> '<%yy%><r><%ww%><|><%d%> <%mmmm%> <%yyyy%><r><%ww%><||><||>256"
oG2antt.TemplateDef = "dim var_Chart"
oG2antt.TemplateDef = var_Chart
oG2antt.Template = "var_Chart.Label(256) = `<|><%ww%><|><%d%> <%m3%> '<%yy%><r><%ww%><|><%d%> <%mmmm%> <%yyyy%><r><%ww%><||><||>256`"
' var_Chart.Label(4096) = "<|><%d1%><|><%d2%><|><%d3%><|><%dddd%><|><%d3%> <%d%> <%m3%> '<%yy%><|><%dddd%> <%d%> <%mmmm%> <%yyyy%><||><||>4096"
oG2antt.TemplateDef = "dim var_Chart"
oG2antt.TemplateDef = var_Chart
oG2antt.Template = "var_Chart.Label(4096) = `<|><%d1%><|><%d2%><|><%d3%><|><%dddd%><|><%d3%> <%d%> <%m3%> '<%yy%><|><%dddd%> <%d%> <%mmmm%> <%yyyy%><||><||>4096`"
' var_Chart.LabelToolTip(256) = "<%d%> <%mmmm%> <%yyyy%> <%ww%>"
oG2antt.TemplateDef = "dim var_Chart"
oG2antt.TemplateDef = var_Chart
oG2antt.Template = "var_Chart.LabelToolTip(256) = `<%d%> <%mmmm%> <%yyyy%> <%ww%>`"
' var_Chart.LabelToolTip(4096) = "<%dddd%> <%d%> <%mmmm%> <%yyyy%>"
oG2antt.TemplateDef = "dim var_Chart"
oG2antt.TemplateDef = var_Chart
oG2antt.Template = "var_Chart.LabelToolTip(4096) = `<%dddd%> <%d%> <%mmmm%> <%yyyy%>`"
var_Chart.FirstWeekDay = 1
var_Chart.MonthNames = "janvier f�vrier mars avril mai juin juillet ao�t septembre octobre novembre d�cembre"
var_Chart.WeekDays = "dimanche lundi mardi mercredi jeudi vendredi samedi"
var_Chart.ToolTip = "<%dddd%> <%d%> <%mmmm%> <%yyyy%>"
var_Chart.UnitScale = 4096
oG2antt.EndUpdate()
|
|
1178
|
How can I determine the last visible date in the chart
' Occurs when the user moves the mouse.
function MouseMove as v (Button  as  N, Shift  as  N, X  as  OLE::Exontrol.G2antt.1::OLE_XPOS_PIXELS, Y  as  OLE::Exontrol.G2antt.1::OLE_YPOS_PIXELS)
	oG2antt = topparent:CONTROL_ACTIVEX1.activex
	? "First"
	? oG2antt.Chart.FirstVisibleDate
	? "Last"
	? oG2antt.Chart.DateFromPoint(1,-1)
end function

Dim oG2antt as P
Dim var_Chart as P

oG2antt = topparent:CONTROL_ACTIVEX1.activex
oG2antt.BeginUpdate()
var_Chart = oG2antt.Chart
	var_Chart.LevelCount = 2
	' var_Chart.PaneWidth(.f.) = 1
	oG2antt.TemplateDef = "dim var_Chart"
	oG2antt.TemplateDef = var_Chart
	oG2antt.Template = "var_Chart.PaneWidth(False) = 1"

oG2antt.EndUpdate()
|
|
1177
|
How can I filter programatically using more columns
Dim oG2antt as P
Dim var_Chart as local
Dim var_Column as P
Dim var_Column1 as P
Dim var_Columns as P
Dim var_Items as P

oG2antt = topparent:CONTROL_ACTIVEX1.activex
oG2antt.BeginUpdate()
' oG2antt.Chart.PaneWidth(.t.) = 0
var_Chart = oG2antt.Chart
oG2antt.TemplateDef = "dim var_Chart"
oG2antt.TemplateDef = var_Chart
oG2antt.Template = "var_Chart.PaneWidth(True) = 0"

oG2antt.MarkSearchColumn = .f.
var_Columns = oG2antt.Columns
	var_Columns.Add("Car")
	var_Columns.Add("Equipment")
var_Items = oG2antt.Items
	' var_Items.CellValue(var_Items.AddItem("Mazda"),1) = "Air Bag"
	oG2antt.TemplateDef = "dim var_Items"
	oG2antt.TemplateDef = var_Items
	oG2antt.Template = "var_Items.CellValue(AddItem(`Mazda`),1) = `Air Bag`"

	' var_Items.CellValue(var_Items.AddItem("Toyota"),1) = "Air Bag,Air condition"
	oG2antt.TemplateDef = "dim var_Items"
	oG2antt.TemplateDef = var_Items
	oG2antt.Template = "var_Items.CellValue(AddItem(`Toyota`),1) = `Air Bag,Air condition`"

	' var_Items.CellValue(var_Items.AddItem("Ford"),1) = "Air condition"
	oG2antt.TemplateDef = "dim var_Items"
	oG2antt.TemplateDef = var_Items
	oG2antt.Template = "var_Items.CellValue(AddItem(`Ford`),1) = `Air condition`"

	' var_Items.CellValue(var_Items.AddItem("Nissan"),1) = "Air Bag,ABS,ESP"
	oG2antt.TemplateDef = "dim var_Items"
	oG2antt.TemplateDef = var_Items
	oG2antt.Template = "var_Items.CellValue(AddItem(`Nissan`),1) = `Air Bag,ABS,ESP`"

	' var_Items.CellValue(var_Items.AddItem("Mazda"),1) = "Air Bag, ABS,ESP"
	oG2antt.TemplateDef = "dim var_Items"
	oG2antt.TemplateDef = var_Items
	oG2antt.Template = "var_Items.CellValue(AddItem(`Mazda`),1) = `Air Bag, ABS,ESP`"

	' var_Items.CellValue(var_Items.AddItem("Mazda"),1) = "ABS,ESP"
	oG2antt.TemplateDef = "dim var_Items"
	oG2antt.TemplateDef = var_Items
	oG2antt.Template = "var_Items.CellValue(AddItem(`Mazda`),1) = `ABS,ESP`"

var_Column = oG2antt.Columns.Item("Car")
	var_Column.FilterType = 240
	var_Column.Filter = "Mazda"
var_Column1 = oG2antt.Columns.Item("Equipment")
	var_Column1.FilterType = 3
	var_Column1.Filter = "*ABS*|*ESP*"
oG2antt.ApplyFilter()
oG2antt.EndUpdate()
|
|
1176
|
Do you have scheduling functionality in Gantt (meaning scheduling several activities (bars) depending on their start and finish dates with considering dependencies to other activities
' Occurs when a bar is moved or resized.
function BarResize as v (Item  as  OLE::Exontrol.G2antt.1::HITEM, Key  as  A)
	oG2antt = topparent:CONTROL_ACTIVEX1.activex
	oG2antt.Items.SchedulePDM(Item,Key)
end function

Dim h1 as N
Dim h2 as N
Dim h3 as N
Dim h4 as N
Dim oG2antt as P
Dim var_Bar as local
Dim var_Chart as P
Dim var_Column as local
Dim var_Items as P

oG2antt = topparent:CONTROL_ACTIVEX1.activex
oG2antt.BeginUpdate()
oG2antt.Items.AllowCellValueToItemBar = .t.
oG2antt.Columns.Add("Task")
' oG2antt.Columns.Add("Working").Def(18) = 258
var_Column = oG2antt.Columns.Add("Working")
oG2antt.TemplateDef = "dim var_Column"
oG2antt.TemplateDef = var_Column
oG2antt.Template = "var_Column.Def(18) = 258"

var_Chart = oG2antt.Chart
	' var_Chart.Bars.Add("Task:Split").Shortcut = "Task"
	var_Bar = var_Chart.Bars.Add("Task:Split")
	oG2antt.TemplateDef = "dim var_Bar"
	oG2antt.TemplateDef = var_Bar
	oG2antt.Template = "var_Bar.Shortcut = `Task`"

	var_Chart.FirstVisibleDate = {12/28/2000}
	' var_Chart.PaneWidth(.f.) = 96
	oG2antt.TemplateDef = "dim var_Chart"
	oG2antt.TemplateDef = var_Chart
	oG2antt.Template = "var_Chart.PaneWidth(False) = 96"

	var_Chart.AllowLinkBars = .f.
	var_Chart.AllowCreateBar = 0
var_Items = oG2antt.Items
	h1 = var_Items.AddItem("Task 1")
	var_Items.AddBar(h1,"Task",{01/02/2001},{01/04/2001},"")
	h2 = var_Items.AddItem("Task 2")
	var_Items.AddBar(h2,"Task",{01/02/2001},{01/04/2001},"")
	var_Items.AddLink("L1",h1,"",h2,"")
	h3 = var_Items.AddItem("Task 3")
	var_Items.AddBar(h3,"Task",{01/02/2001},{01/06/2001},"")
	var_Items.AddLink("L2",h2,"",h3,"")
	' var_Items.Link("L2",12) = "FF"
	oG2antt.TemplateDef = "dim var_Items"
	oG2antt.TemplateDef = var_Items
	oG2antt.Template = "var_Items.Link(`L2`,12) = `FF`"

	' var_Items.Link("L2",6) = 2
	oG2antt.TemplateDef = "dim var_Items"
	oG2antt.TemplateDef = var_Items
	oG2antt.Template = "var_Items.Link(`L2`,6) = 2"

	' var_Items.Link("L2",7) = 2
	oG2antt.TemplateDef = "dim var_Items"
	oG2antt.TemplateDef = var_Items
	oG2antt.Template = "var_Items.Link(`L2`,7) = 2"

	h4 = var_Items.AddItem("Task 4")
	var_Items.AddBar(h4,"Task",{01/02/2001},{01/04/2001},"")
	var_Items.AddLink("L3",h4,"",h3,"")
	' var_Items.ItemBar(0,"<*>",20) = .t.
	oG2antt.TemplateDef = "dim var_Items"
	oG2antt.TemplateDef = var_Items
	oG2antt.Template = "var_Items.ItemBar(0,`<*>`,20) = True"

	var_Items.SchedulePDM(var_Items.FirstVisibleItem,"")
oG2antt.EndUpdate()
|
|
1175
|
How can I show the ticks for a single slider field
Dim oG2antt as P
Dim var_Editor as local
Dim var_Editor1 as P
Dim var_Items as P

oG2antt = topparent:CONTROL_ACTIVEX1.activex
oG2antt.BeginUpdate()
' oG2antt.Columns.Add("Slider").Editor.EditType = 20
var_Editor = oG2antt.Columns.Add("Slider").Editor
oG2antt.TemplateDef = "dim var_Editor"
oG2antt.TemplateDef = var_Editor
oG2antt.Template = "var_Editor.EditType = 20"

var_Items = oG2antt.Items
	var_Items.AddItem(10)
	var_Editor1 = var_Items.CellEditor(var_Items.AddItem(20),0)
		var_Editor1.EditType = 20
		' var_Editor1.Option(53) = 10
		oG2antt.TemplateDef = "dim var_Editor1"
		oG2antt.TemplateDef = var_Editor1
		oG2antt.Template = "var_Editor1.Option(53) = 10"

	var_Items.AddItem(30)
oG2antt.EndUpdate()
|
|
1174
|
Is it possible to show ticks for slider fields
Dim oG2antt as P
Dim var_Editor as P

oG2antt = topparent:CONTROL_ACTIVEX1.activex
var_Editor = oG2antt.Columns.Add("Slider").Editor
	var_Editor.EditType = 20
	' var_Editor.Option(53) = 10
	oG2antt.TemplateDef = "dim var_Editor"
	oG2antt.TemplateDef = var_Editor
	oG2antt.Template = "var_Editor.Option(53) = 10"

oG2antt.Items.AddItem(10)
|
|
1173
|
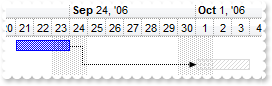
How can I group two bars so the distance between them is limited to a specified range
Dim h1 as N
Dim h2 as N
Dim oG2antt as P
Dim var_Chart as P
Dim var_Items as P

oG2antt = topparent:CONTROL_ACTIVEX1.activex
oG2antt.BeginUpdate()
oG2antt.Columns.Add("Tasks")
var_Chart = oG2antt.Chart
	var_Chart.FirstVisibleDate = {09/20/2006}
	' var_Chart.PaneWidth(.f.) = 48
	oG2antt.TemplateDef = "dim var_Chart"
	oG2antt.TemplateDef = var_Chart
	oG2antt.Template = "var_Chart.PaneWidth(0) = 48"

	var_Chart.LevelCount = 2
var_Items = oG2antt.Items
	h1 = var_Items.AddItem("Task 1")
	var_Items.AddBar(h1,"Task",{09/21/2006},{09/24/2006})
	h2 = var_Items.AddItem("Task 2")
	var_Items.AddBar(h2,"Unknown",{09/25/2006},{09/28/2006})
	var_Items.AddLink("L1",h1,"",h2,"")
	var_Items.GroupBars(h1,"",.f.,h2,"",.t.,31,"1;2")
	? "The distance between A and B is limited between 1 and 3 days"
	? "The B is always after the A"
oG2antt.EndUpdate()
|
|
1172
|
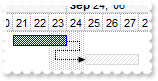
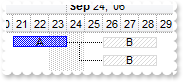
How can I group two bars so the distance between them is flexible but never less than a specified value
Dim h1 as N
Dim h2 as N
Dim oG2antt as P
Dim var_Chart as P
Dim var_Items as P

oG2antt = topparent:CONTROL_ACTIVEX1.activex
oG2antt.BeginUpdate()
oG2antt.Columns.Add("Tasks")
var_Chart = oG2antt.Chart
	var_Chart.FirstVisibleDate = {09/20/2006}
	' var_Chart.PaneWidth(.f.) = 48
	oG2antt.TemplateDef = "dim var_Chart"
	oG2antt.TemplateDef = var_Chart
	oG2antt.Template = "var_Chart.PaneWidth(0) = 48"

	var_Chart.LevelCount = 2
var_Items = oG2antt.Items
	h1 = var_Items.AddItem("Task 1")
	var_Items.AddBar(h1,"Task",{09/21/2006},{09/24/2006})
	h2 = var_Items.AddItem("Task 2")
	var_Items.AddBar(h2,"Unknown",{09/26/2006},{09/29/2006})
	var_Items.AddLink("L1",h1,"",h2,"")
	var_Items.GroupBars(h1,"",.f.,h2,"",.t.,39,"2")
	? "The distance between A and B is never less than 2 days"
	? "The B is always after the A"
oG2antt.EndUpdate()
|
|
1171
|
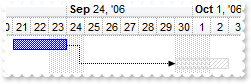
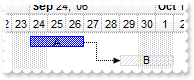
How can I group two bars so the distance between them is flexible
Dim h1 as N
Dim h2 as N
Dim oG2antt as P
Dim var_Chart as P
Dim var_Items as P

oG2antt = topparent:CONTROL_ACTIVEX1.activex
oG2antt.BeginUpdate()
oG2antt.Columns.Add("Tasks")
var_Chart = oG2antt.Chart
	var_Chart.FirstVisibleDate = {09/20/2006}
	' var_Chart.PaneWidth(.f.) = 48
	oG2antt.TemplateDef = "dim var_Chart"
	oG2antt.TemplateDef = var_Chart
	oG2antt.Template = "var_Chart.PaneWidth(0) = 48"

	var_Chart.LevelCount = 2
var_Items = oG2antt.Items
	h1 = var_Items.AddItem("Task 1")
	var_Items.AddBar(h1,"Task",{09/21/2006},{09/24/2006})
	h2 = var_Items.AddItem("Task 2")
	var_Items.AddBar(h2,"Unknown",{09/26/2006},{09/29/2006})
	var_Items.AddLink("L1",h1,"",h2,"")
	var_Items.GroupBars(h1,"",.f.,h2,"",.t.,39)
	? "The distance between A and B is flexible, unlimited"
	? "The B is always after the A"
oG2antt.EndUpdate()
|
|
1170
|
How can I group two bars so the interval between them is fixed
Dim h as N
Dim h2 as N
Dim oG2antt as P
Dim var_Chart as P
Dim var_Items as P

oG2antt = topparent:CONTROL_ACTIVEX1.activex
oG2antt.BeginUpdate()
oG2antt.Columns.Add("Tasks")
var_Chart = oG2antt.Chart
	var_Chart.FirstVisibleDate = {09/20/2006}
	' var_Chart.PaneWidth(.f.) = 48
	oG2antt.TemplateDef = "dim var_Chart"
	oG2antt.TemplateDef = var_Chart
	oG2antt.Template = "var_Chart.PaneWidth(0) = 48"

	var_Chart.LevelCount = 2
var_Items = oG2antt.Items
	h = var_Items.AddItem("Task 1")
	var_Items.AddBar(h,"Task",{09/21/2006},{09/24/2006},"T1","A")
	var_Items.AddBar(h,"Unknown",{09/26/2006},{09/29/2006},"T2","B")
	var_Items.AddLink("L",h,"T1",h,"T2")
	' var_Items.Link("L",258) = 27
	oG2antt.TemplateDef = "dim var_Items"
	oG2antt.TemplateDef = var_Items
	oG2antt.Template = "var_Items.Link(`L`,258) = 27"

	' var_Items.Link("L",11) = .f.
	oG2antt.TemplateDef = "dim var_Items"
	oG2antt.TemplateDef = var_Items
	oG2antt.Template = "var_Items.Link(`L`,11) = False"

	h2 = var_Items.AddItem("Task 2")
	var_Items.AddBar(h2,"Unknown",{09/26/2006},{09/29/2006},"T2","B")
	var_Items.AddLink("L2",h,"T1",h2,"T2")
	' var_Items.Link("L2",258) = 27
	oG2antt.TemplateDef = "dim var_Items"
	oG2antt.TemplateDef = var_Items
	oG2antt.Template = "var_Items.Link(`L2`,258) = 27"

	' var_Items.Link("L2",11) = .f.
	oG2antt.TemplateDef = "dim var_Items"
	oG2antt.TemplateDef = var_Items
	oG2antt.Template = "var_Items.Link(`L2`,11) = False"

	? "The distance between bars is constant"
	? "The B is always after the A"
oG2antt.EndUpdate()
|
|
1169
|
How can I group two bars when linking, so moving the first bar will makes the second to move accordingly
Dim h1 as N
Dim h2 as N
Dim oG2antt as P
Dim var_Chart as P
Dim var_Items as P

oG2antt = topparent:CONTROL_ACTIVEX1.activex
oG2antt.BeginUpdate()
oG2antt.Columns.Add("Tasks")
var_Chart = oG2antt.Chart
	var_Chart.FirstVisibleDate = {09/20/2006}
	' var_Chart.PaneWidth(.f.) = 48
	oG2antt.TemplateDef = "dim var_Chart"
	oG2antt.TemplateDef = var_Chart
	oG2antt.Template = "var_Chart.PaneWidth(0) = 48"

	var_Chart.LevelCount = 2
var_Items = oG2antt.Items
	h1 = var_Items.AddItem("Task 1")
	var_Items.AddBar(h1,"Task",{09/21/2006},{09/24/2006},"","A")
	h2 = var_Items.AddItem("Task 2")
	var_Items.AddBar(h2,"Unknown",{09/26/2006},{09/29/2006},"","B")
	var_Items.AddLink("L1",h1,"",h2,"")
	' var_Items.Link("L1",258) = 39
	oG2antt.TemplateDef = "dim var_Items"
	oG2antt.TemplateDef = var_Items
	oG2antt.Template = "var_Items.Link(`L1`,258) = 39"

	? "The distance between A and B is flexible, unlimited"
	? "The B is always after the A"
oG2antt.EndUpdate()
|
|
1168
|
Is it possible to be notified when the user clicks an anchor element a hyperlink in the date-time zone
' Occurs when an anchor element is clicked.
function AnchorClick as v (AnchorID  as  C, Options  as  C)
	oG2antt = topparent:CONTROL_ACTIVEX1.activex
	? "Click: "
	? AnchorID
end function

Dim oG2antt as P
Dim var_Chart as P

oG2antt = topparent:CONTROL_ACTIVEX1.activex
oG2antt.BeginUpdate()
var_Chart = oG2antt.Chart
	var_Chart.FirstVisibleDate = {12/28/2000}
	' var_Chart.PaneWidth(.f.) = 48
	oG2antt.TemplateDef = "dim var_Chart"
	oG2antt.TemplateDef = var_Chart
	oG2antt.Template = "var_Chart.PaneWidth(False) = 48"

	var_Chart.MarkTimeZone("Z",{01/02/2001},{01/05/2001},15753471,";32;Caption <a1><b>1</b></a>;1;Caption <a2><b>2</b></a>;17;Caption <a3><b>3</b></a>")
oG2antt.EndUpdate()
|
|
1167
|
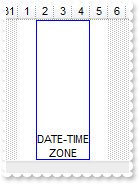
Is it possible to be notified when the user clicks a date-time zone
' Occurs when the user presses and then releases the left mouse button over the tree control.
function Click as v ()
	Dim var_Chart as P
	oG2antt = topparent:CONTROL_ACTIVEX1.activex
	var_Chart = oG2antt.Chart
		? "Click: "
		? var_Chart.TimeZoneFromPoint(-1,-1)
end function

Dim oG2antt as P
Dim var_Chart as P

oG2antt = topparent:CONTROL_ACTIVEX1.activex
oG2antt.BeginUpdate()
var_Chart = oG2antt.Chart
	var_Chart.FirstVisibleDate = {12/28/2000}
	' var_Chart.PaneWidth(.f.) = 48
	oG2antt.TemplateDef = "dim var_Chart"
	oG2antt.TemplateDef = var_Chart
	oG2antt.Template = "var_Chart.PaneWidth(False) = 48"

	var_Chart.MarkTimeZone("Z",{01/02/2001},{01/05/2001},16711680,";32;DATE-TIME<br>    ZONE")
oG2antt.EndUpdate()
|
|
1166
|
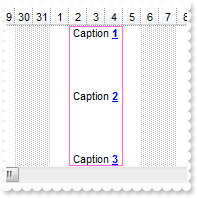
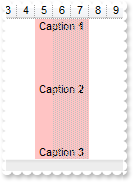
Is is possible to display multiple captions in the same date-time zone
Dim oG2antt as P
Dim var_Chart as P

oG2antt = topparent:CONTROL_ACTIVEX1.activex
oG2antt.BeginUpdate()
var_Chart = oG2antt.Chart
	var_Chart.FirstVisibleDate = {12/28/2000}
	' var_Chart.PaneWidth(.f.) = 48
	oG2antt.TemplateDef = "dim var_Chart"
	oG2antt.TemplateDef = var_Chart
	oG2antt.Template = "var_Chart.PaneWidth(False) = 48"

	var_Chart.MarkTimeZone("Z",{01/05/2001},{01/08/2001},12895487,";;Caption <b>1</b>;1;Caption <b>2</b>;17;Caption <b>3</b>")
oG2antt.EndUpdate()
|
|
1165
|
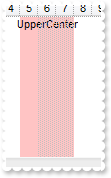
Is is possible to align on the top the caption for the date-time zone
Dim oG2antt as P
Dim var_Chart as P

oG2antt = topparent:CONTROL_ACTIVEX1.activex
oG2antt.BeginUpdate()
var_Chart = oG2antt.Chart
	var_Chart.FirstVisibleDate = {12/28/2000}
	' var_Chart.PaneWidth(.f.) = 48
	oG2antt.TemplateDef = "dim var_Chart"
	oG2antt.TemplateDef = var_Chart
	oG2antt.Template = "var_Chart.PaneWidth(False) = 48"

	var_Chart.MarkTimeZone("Z",{01/05/2001},{01/08/2001},12895487,";;UpperCenter;1")
oG2antt.EndUpdate()
|
|
1164
|
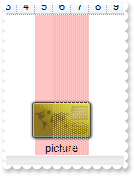
Is there any option to display a picture on the date-time zone
Dim oG2antt as P
Dim var_Chart as P

oG2antt = topparent:CONTROL_ACTIVEX1.activex
oG2antt.BeginUpdate()
oG2antt.Template = "HTMLPicture(`pic1`) = `c:\exontrol\images\card.png`" // oG2antt.HTMLPicture("pic1") = "c:\exontrol\images\card.png"
var_Chart = oG2antt.Chart
	var_Chart.FirstVisibleDate = {12/28/2000}
	' var_Chart.PaneWidth(.f.) = 48
	oG2antt.TemplateDef = "dim var_Chart"
	oG2antt.TemplateDef = var_Chart
	oG2antt.Template = "var_Chart.PaneWidth(False) = 48"

	var_Chart.MarkTimeZone("Z",{01/05/2001},{01/08/2001},12895487,";;<c><img>pic1</img><br><c>picture")
oG2antt.EndUpdate()
|
|
1163
|
Is there any option to display a text or a HTML caption on the date-time zone
Dim oG2antt as P
Dim var_Chart as P

oG2antt = topparent:CONTROL_ACTIVEX1.activex
oG2antt.BeginUpdate()
var_Chart = oG2antt.Chart
	var_Chart.FirstVisibleDate = {12/28/2000}
	' var_Chart.PaneWidth(.f.) = 48
	oG2antt.TemplateDef = "dim var_Chart"
	oG2antt.TemplateDef = var_Chart
	oG2antt.Template = "var_Chart.PaneWidth(False) = 48"

	var_Chart.MarkTimeZone("Z1",{01/01/2001},{01/04/2001},12895487,";;zone <b>1</b>")
	var_Chart.MarkTimeZone("Z2",{01/05/2001},{01/08/2001},12895487,";;zone <b>2</b>")
oG2antt.EndUpdate()
|
|
1162
|
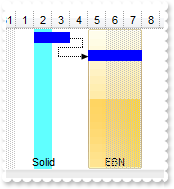
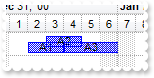
How can I display the date-time zone using a semi-transparent EBN object
Dim h1 as N
Dim h2 as N
Dim oG2antt as P
Dim var_Chart as P
Dim var_Items as P

oG2antt = topparent:CONTROL_ACTIVEX1.activex
oG2antt.BeginUpdate()
oG2antt.VisualAppearance.Add(1,"c:\exontrol\images\normal.ebn")
oG2antt.Columns.Add("Task")
var_Chart = oG2antt.Chart
	var_Chart.FirstVisibleDate = {12/28/2000}
	' var_Chart.PaneWidth(.f.) = 48
	oG2antt.TemplateDef = "dim var_Chart"
	oG2antt.TemplateDef = var_Chart
	oG2antt.Template = "var_Chart.PaneWidth(False) = 48"

	var_Chart.AllowLinkBars = .f.
	var_Chart.AllowCreateBar = 0
	var_Chart.Bars.Item("Task").Pattern = 1
	var_Chart.MarkTimeZone("Z1",{01/02/2001},{01/03/2001},16777056,";;Solid")
	var_Chart.MarkTimeZone("Z2",{01/07/2001},{01/10/2001},16777216,"50;;EBN")
var_Items = oG2antt.Items
	h1 = var_Items.AddItem("Task 1")
	var_Items.AddBar(h1,"Task",{01/02/2001},{01/04/2001},"K1")
	h2 = var_Items.AddItem("Task 2")
	var_Items.AddBar(h2,"Task",{01/05/2001},{01/08/2001},"K2")
	var_Items.AddLink("L1",h1,"K1",h2,"K2")
oG2antt.EndUpdate()
|
|
1161
|
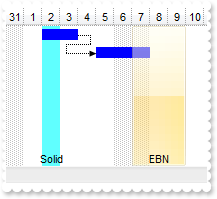
How can I display the date-time zone using an EBN or a skin instead a solid color
Dim h1 as N
Dim h2 as N
Dim oG2antt as P
Dim var_Chart as P
Dim var_Items as P

oG2antt = topparent:CONTROL_ACTIVEX1.activex
oG2antt.BeginUpdate()
oG2antt.VisualAppearance.Add(1,"c:\exontrol\images\normal.ebn")
oG2antt.Columns.Add("Task")
var_Chart = oG2antt.Chart
	var_Chart.FirstVisibleDate = {12/28/2000}
	' var_Chart.PaneWidth(.f.) = 48
	oG2antt.TemplateDef = "dim var_Chart"
	oG2antt.TemplateDef = var_Chart
	oG2antt.Template = "var_Chart.PaneWidth(False) = 48"

	var_Chart.AllowLinkBars = .f.
	var_Chart.AllowCreateBar = 0
	var_Chart.Bars.Item("Task").Pattern = 1
	var_Chart.MarkTimeZone("Z1",{01/02/2001},{01/03/2001},16777056,";;Solid")
	var_Chart.MarkTimeZone("Z2",{01/05/2001},{01/08/2001},16777216,";;EBN")
var_Items = oG2antt.Items
	h1 = var_Items.AddItem("Task 1")
	var_Items.AddBar(h1,"Task",{01/02/2001},{01/04/2001},"K1")
	h2 = var_Items.AddItem("Task 2")
	var_Items.AddBar(h2,"Task",{01/05/2001},{01/08/2001},"K2")
	var_Items.AddLink("L1",h1,"K1",h2,"K2")
oG2antt.EndUpdate()
|
|
1160
|
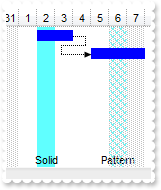
How can I display the date-time zone using a pattern instead a solid color
Dim h1 as N
Dim h2 as N
Dim oG2antt as P
Dim var_Chart as P
Dim var_Items as P

oG2antt = topparent:CONTROL_ACTIVEX1.activex
oG2antt.BeginUpdate()
oG2antt.Columns.Add("Task")
var_Chart = oG2antt.Chart
	var_Chart.FirstVisibleDate = {12/28/2000}
	' var_Chart.PaneWidth(.f.) = 48
	oG2antt.TemplateDef = "dim var_Chart"
	oG2antt.TemplateDef = var_Chart
	oG2antt.Template = "var_Chart.PaneWidth(False) = 48"

	var_Chart.AllowLinkBars = .f.
	var_Chart.AllowCreateBar = 0
	var_Chart.Bars.Item("Task").Pattern = 1
	var_Chart.MarkTimeZone("Z1",{01/02/2001},{01/03/2001},16777056,";;Solid")
	var_Chart.MarkTimeZone("Z2",{01/06/2001},{01/07/2001},16777056,";12;Pattern")
var_Items = oG2antt.Items
	h1 = var_Items.AddItem("Task 1")
	var_Items.AddBar(h1,"Task",{01/02/2001},{01/04/2001},"K1")
	h2 = var_Items.AddItem("Task 2")
	var_Items.AddBar(h2,"Task",{01/05/2001},{01/08/2001},"K2")
	var_Items.AddLink("L1",h1,"K1",h2,"K2")
oG2antt.EndUpdate()
|
|
1159
|
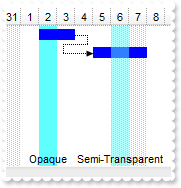
How can I display the date-time zone using a transparent color
Dim h1 as N
Dim h2 as N
Dim oG2antt as P
Dim var_Chart as P
Dim var_Items as P

oG2antt = topparent:CONTROL_ACTIVEX1.activex
oG2antt.BeginUpdate()
oG2antt.Columns.Add("Task")
var_Chart = oG2antt.Chart
	var_Chart.FirstVisibleDate = {12/28/2000}
	' var_Chart.PaneWidth(.f.) = 48
	oG2antt.TemplateDef = "dim var_Chart"
	oG2antt.TemplateDef = var_Chart
	oG2antt.Template = "var_Chart.PaneWidth(False) = 48"

	var_Chart.AllowLinkBars = .f.
	var_Chart.AllowCreateBar = 0
	var_Chart.Bars.Item("Task").Pattern = 1
	var_Chart.MarkTimeZone("Z1",{01/02/2001},{01/03/2001},16777056,";;Opaque")
	var_Chart.MarkTimeZone("Z2",{01/06/2001},{01/07/2001},16777056,"50;;Semi-Transparent")
var_Items = oG2antt.Items
	h1 = var_Items.AddItem("Task 1")
	var_Items.AddBar(h1,"Task",{01/02/2001},{01/04/2001},"K1")
	h2 = var_Items.AddItem("Task 2")
	var_Items.AddBar(h2,"Task",{01/05/2001},{01/08/2001},"K2")
	var_Items.AddLink("L1",h1,"K1",h2,"K2")
oG2antt.EndUpdate()
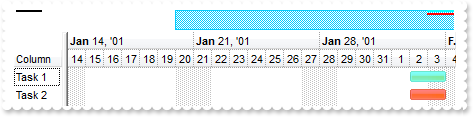
|
|
1158
|
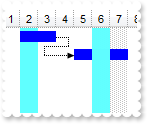
The date time zone is shown behind the bars, is there any way to show it over
Dim h1 as N
Dim h2 as N
Dim oG2antt as P
Dim var_Chart as P
Dim var_Items as P

oG2antt = topparent:CONTROL_ACTIVEX1.activex
oG2antt.BeginUpdate()
oG2antt.Columns.Add("Task")
var_Chart = oG2antt.Chart
	var_Chart.FirstVisibleDate = {12/28/2000}
	' var_Chart.PaneWidth(.f.) = 48
	oG2antt.TemplateDef = "dim var_Chart"
	oG2antt.TemplateDef = var_Chart
	oG2antt.Template = "var_Chart.PaneWidth(False) = 48"

	var_Chart.AllowLinkBars = .f.
	var_Chart.AllowCreateBar = 0
	var_Chart.Bars.Item("Task").Pattern = 1
	var_Chart.MarkTimeZone("Z1",{01/02/2001},{01/03/2001},16777056)
	var_Chart.MarkTimeZone("Z2",{01/06/2001},{01/07/2001},16777056,"1")
var_Items = oG2antt.Items
	h1 = var_Items.AddItem("Task 1")
	var_Items.AddBar(h1,"Task",{01/02/2001},{01/04/2001},"K1")
	h2 = var_Items.AddItem("Task 2")
	var_Items.AddBar(h2,"Task",{01/05/2001},{01/08/2001},"K2")
	var_Items.AddLink("L1",h1,"K1",h2,"K2")
oG2antt.EndUpdate()
|
|
1157
|
How can I get ifnromation about a date-time zone
' Occurs when the user moves the mouse.
function MouseMove as v (Button  as  N, Shift  as  N, X  as  OLE::Exontrol.G2antt.1::OLE_XPOS_PIXELS, Y  as  OLE::Exontrol.G2antt.1::OLE_YPOS_PIXELS)
	Dim var_Chart as P
	oG2antt = topparent:CONTROL_ACTIVEX1.activex
	var_Chart = oG2antt.Chart
		? var_Chart.TimeZoneInfo(var_Chart.TimeZoneFromPoint(-1,-1))
end function

Dim oG2antt as P
Dim var_Chart as P

oG2antt = topparent:CONTROL_ACTIVEX1.activex
var_Chart = oG2antt.Chart
	' var_Chart.PaneWidth(.f.) = 18
	oG2antt.TemplateDef = "dim var_Chart"
	oG2antt.TemplateDef = var_Chart
	oG2antt.Template = "var_Chart.PaneWidth(False) = 18"

	var_Chart.LevelCount = 2
	var_Chart.FirstVisibleDate = {01/01/2010}
	var_Chart.MarkTimeZone("Z1",{01/04/2010},{01/08/2010},16744544)
	var_Chart.MarkTimeZone("Z2",{01/12/2010},{01/18/2010},16761952)
|
|
1156
|
How can I determine the zone from the cursor
' Occurs when the user moves the mouse.
function MouseMove as v (Button  as  N, Shift  as  N, X  as  OLE::Exontrol.G2antt.1::OLE_XPOS_PIXELS, Y  as  OLE::Exontrol.G2antt.1::OLE_YPOS_PIXELS)
	Dim var_Chart as P
	oG2antt = topparent:CONTROL_ACTIVEX1.activex
	var_Chart = oG2antt.Chart
		? var_Chart.TimeZoneFromPoint(-1,-1)
end function

Dim oG2antt as P
Dim var_Chart as P

oG2antt = topparent:CONTROL_ACTIVEX1.activex
var_Chart = oG2antt.Chart
	' var_Chart.PaneWidth(.f.) = 18
	oG2antt.TemplateDef = "dim var_Chart"
	oG2antt.TemplateDef = var_Chart
	oG2antt.Template = "var_Chart.PaneWidth(False) = 18"

	var_Chart.LevelCount = 2
	var_Chart.FirstVisibleDate = {01/01/2010}
	var_Chart.MarkTimeZone("Z1",{01/04/2010},{01/08/2010},16744544)
	var_Chart.MarkTimeZone("Z2",{01/12/2010},{01/18/2010},16761952)
|
|
1155
|
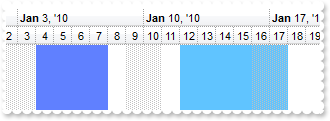
How can I highlight multiple date-time zones (ranges)
Dim oG2antt as P
Dim var_Chart as P

oG2antt = topparent:CONTROL_ACTIVEX1.activex
var_Chart = oG2antt.Chart
	' var_Chart.PaneWidth(.f.) = 18
	oG2antt.TemplateDef = "dim var_Chart"
	oG2antt.TemplateDef = var_Chart
	oG2antt.Template = "var_Chart.PaneWidth(False) = 18"

	var_Chart.LevelCount = 2
	var_Chart.FirstVisibleDate = {01/01/2010}
	var_Chart.MarkTimeZone("Z1",{01/04/2010},{01/08/2010},16744544)
	var_Chart.MarkTimeZone("Z2",{01/12/2010},{01/18/2010},16761952)
|
|
1154
|
How can I highlight a date-time range
Dim oG2antt as P
Dim var_Chart as P

oG2antt = topparent:CONTROL_ACTIVEX1.activex
var_Chart = oG2antt.Chart
	' var_Chart.PaneWidth(.f.) = 18
	oG2antt.TemplateDef = "dim var_Chart"
	oG2antt.TemplateDef = var_Chart
	oG2antt.Template = "var_Chart.PaneWidth(False) = 18"

	var_Chart.LevelCount = 2
	var_Chart.FirstVisibleDate = {01/01/2010}
	var_Chart.MarkTimeZone("Z1",{01/04/2010},{01/08/2010},16744544)
|
|
1153
|
How do I get the list of selected date
' Occurs after the chart has been changed.
function ChartEndChanging as v (Operation  as  OLE::Exontrol.G2antt.1::BarOperationEnum)
	oG2antt = topparent:CONTROL_ACTIVEX1.activex
	? Operation
	? oG2antt.Chart.SelectDates
end function

Dim oG2antt as P
Dim var_Chart as P

oG2antt = topparent:CONTROL_ACTIVEX1.activex
var_Chart = oG2antt.Chart
	var_Chart.LevelCount = 2
	' var_Chart.PaneWidth(.f.) = 0
	oG2antt.TemplateDef = "dim var_Chart"
	oG2antt.TemplateDef = var_Chart
	oG2antt.Template = "var_Chart.PaneWidth(False) = 0"

	var_Chart.MarkTodayColor = var_Chart.BackColor
|
|
1152
|
Is there any function I can use to find the bars that intersect with the current bar
' Occurs when a bar is moving or resizing.
function BarResizing as v (Item  as  OLE::Exontrol.G2antt.1::HITEM, Key  as  A)
	Dim var_Items as P
	oG2antt = topparent:CONTROL_ACTIVEX1.activex
	var_Items = oG2antt.Items
		? Key
		? "intesect with"
		? var_Items.ItemBar(Item,Key,520)
end function

Dim h1 as N
Dim oG2antt as P
Dim var_Chart as P
Dim var_Items as P

oG2antt = topparent:CONTROL_ACTIVEX1.activex
oG2antt.BeginUpdate()
oG2antt.DefaultItemHeight = 22
oG2antt.Columns.Add("Task")
oG2antt.ScrollBySingleLine = .t.
oG2antt.DrawGridLines = -1
var_Chart = oG2antt.Chart
	var_Chart.DrawGridLines = -1
	' var_Chart.PaneWidth(.f.) = 48
	oG2antt.TemplateDef = "dim var_Chart"
	oG2antt.TemplateDef = var_Chart
	oG2antt.Template = "var_Chart.PaneWidth(False) = 48"

	var_Chart.FirstVisibleDate = {12/28/2000}
	var_Chart.LevelCount = 2
	var_Chart.Bars.Item("Task").OverlaidType = 1
	var_Chart.ResizeUnitScale = 65536
	var_Chart.AllowCreateBar = 1
var_Items = oG2antt.Items
	h1 = var_Items.AddItem("Default")
	var_Items.AddBar(h1,"Task",{01/02/2001},{01/04/2001},"A1","A1")
	var_Items.AddBar(h1,"Task",{01/03/2001},{01/05/2001},"A2","A2")
	var_Items.AddBar(h1,"Task",{01/04/2001},{01/07/2001},"A3","A3")
oG2antt.EndUpdate()
|
|
1151
|
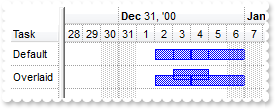
Is it possible to order the bars on top of other bars
Dim h1 as N
Dim h2 as N
Dim oG2antt as P
Dim var_Bar as local
Dim var_Chart as P
Dim var_Items as P

oG2antt = topparent:CONTROL_ACTIVEX1.activex
oG2antt.BeginUpdate()
oG2antt.DefaultItemHeight = 22
oG2antt.Columns.Add("Task")
oG2antt.ScrollBySingleLine = .t.
oG2antt.DrawGridLines = -1
var_Chart = oG2antt.Chart
	var_Chart.DrawGridLines = -1
	' var_Chart.PaneWidth(.f.) = 48
	oG2antt.TemplateDef = "dim var_Chart"
	oG2antt.TemplateDef = var_Chart
	oG2antt.Template = "var_Chart.PaneWidth(False) = 48"

	var_Chart.FirstVisibleDate = {12/28/2000}
	var_Chart.LevelCount = 2
	' var_Chart.Bars.Copy("Task","NTask").OverlaidType = 1
	var_Bar = var_Chart.Bars.Copy("Task","NTask")
	oG2antt.TemplateDef = "dim var_Bar"
	oG2antt.TemplateDef = var_Bar
	oG2antt.Template = "var_Bar.OverlaidType = 1"

var_Items = oG2antt.Items
	h1 = var_Items.AddItem("Default")
	var_Items.AddBar(h1,"Task",{01/02/2001},{01/04/2001},"A1")
	var_Items.AddBar(h1,"Task",{01/03/2001},{01/05/2001},"A2")
	var_Items.AddBar(h1,"Task",{01/04/2001},{01/07/2001},"A3")
	h2 = var_Items.AddItem("Overlaid")
	var_Items.AddBar(h2,"NTask",{01/02/2001},{01/04/2001},"A1")
	var_Items.AddBar(h2,"NTask",{01/03/2001},{01/05/2001},"A2")
	var_Items.AddBar(h2,"NTask",{01/04/2001},{01/07/2001},"A3")
	var_Items.GroupBars(h1,"A1",.t.,h2,"A1",.t.)
	var_Items.GroupBars(h1,"A1",.f.,h2,"A1",.f.)
	var_Items.GroupBars(h1,"A2",.t.,h2,"A2",.t.)
	var_Items.GroupBars(h1,"A2",.f.,h2,"A2",.f.)
	var_Items.GroupBars(h1,"A3",.t.,h2,"A3",.t.)
	var_Items.GroupBars(h1,"A3",.f.,h2,"A3",.f.)
oG2antt.EndUpdate()
|
|
1150
|
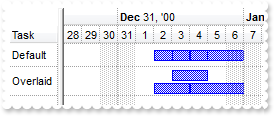
Is it possible to order the bars on top of other bars (have different colurs so that they can be seen)
Dim h1 as N
Dim h2 as N
Dim oG2antt as P
Dim var_Bar as local
Dim var_Chart as P
Dim var_Items as P

oG2antt = topparent:CONTROL_ACTIVEX1.activex
oG2antt.BeginUpdate()
oG2antt.DefaultItemHeight = 22
oG2antt.Columns.Add("Task")
oG2antt.ScrollBySingleLine = .t.
oG2antt.DrawGridLines = -1
var_Chart = oG2antt.Chart
	var_Chart.DrawGridLines = -1
	' var_Chart.PaneWidth(.f.) = 48
	oG2antt.TemplateDef = "dim var_Chart"
	oG2antt.TemplateDef = var_Chart
	oG2antt.Template = "var_Chart.PaneWidth(False) = 48"

	var_Chart.FirstVisibleDate = {12/28/2000}
	var_Chart.LevelCount = 2
	' var_Chart.Bars.Copy("Task","NTask").OverlaidType = 515 'exOverlaidBarsStackAutoArrange + exOverlaidBarsStack
	var_Bar = var_Chart.Bars.Copy("Task","NTask")
	oG2antt.TemplateDef = "dim var_Bar"
	oG2antt.TemplateDef = var_Bar
	oG2antt.Template = "var_Bar.OverlaidType = 515"

var_Items = oG2antt.Items
	h1 = var_Items.AddItem("Default")
	var_Items.AddBar(h1,"Task",{01/02/2001},{01/04/2001},"A1")
	var_Items.AddBar(h1,"Task",{01/03/2001},{01/05/2001},"A2")
	var_Items.AddBar(h1,"Task",{01/04/2001},{01/07/2001},"A3")
	h2 = var_Items.AddItem("Overlaid")
	var_Items.AddBar(h2,"NTask",{01/02/2001},{01/04/2001},"A1")
	var_Items.AddBar(h2,"NTask",{01/03/2001},{01/05/2001},"A2")
	var_Items.AddBar(h2,"NTask",{01/04/2001},{01/07/2001},"A3")
	var_Items.GroupBars(h1,"A1",.t.,h2,"A1",.t.)
	var_Items.GroupBars(h1,"A1",.f.,h2,"A1",.f.)
	var_Items.GroupBars(h1,"A2",.t.,h2,"A2",.t.)
	var_Items.GroupBars(h1,"A2",.f.,h2,"A2",.f.)
	var_Items.GroupBars(h1,"A3",.t.,h2,"A3",.t.)
	var_Items.GroupBars(h1,"A3",.f.,h2,"A3",.f.)
oG2antt.EndUpdate()
|
|
1149
|
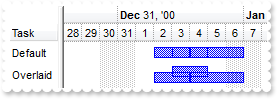
Is it possible to layer bars on top of other bars (have different colurs so that they can be seen)
Dim h1 as N
Dim h2 as N
Dim oG2antt as P
Dim var_Bar as local
Dim var_Chart as P
Dim var_Items as P

oG2antt = topparent:CONTROL_ACTIVEX1.activex
oG2antt.BeginUpdate()
oG2antt.DefaultItemHeight = 22
oG2antt.Columns.Add("Task")
var_Chart = oG2antt.Chart
	' var_Chart.PaneWidth(.f.) = 48
	oG2antt.TemplateDef = "dim var_Chart"
	oG2antt.TemplateDef = var_Chart
	oG2antt.Template = "var_Chart.PaneWidth(False) = 48"

	var_Chart.FirstVisibleDate = {12/28/2000}
	var_Chart.LevelCount = 2
	' var_Chart.Bars.Copy("Task","NTask").OverlaidType = 1
	var_Bar = var_Chart.Bars.Copy("Task","NTask")
	oG2antt.TemplateDef = "dim var_Bar"
	oG2antt.TemplateDef = var_Bar
	oG2antt.Template = "var_Bar.OverlaidType = 1"

var_Items = oG2antt.Items
	h1 = var_Items.AddItem("Default")
	var_Items.AddBar(h1,"Task",{01/02/2001},{01/04/2001},"A1")
	var_Items.AddBar(h1,"Task",{01/03/2001},{01/05/2001},"A2")
	var_Items.AddBar(h1,"Task",{01/04/2001},{01/07/2001},"A3")
	h2 = var_Items.AddItem("Overlaid")
	var_Items.AddBar(h2,"NTask",{01/02/2001},{01/04/2001},"A1")
	var_Items.AddBar(h2,"NTask",{01/03/2001},{01/05/2001},"A2")
	var_Items.AddBar(h2,"NTask",{01/04/2001},{01/07/2001},"A3")
	var_Items.GroupBars(h1,"A1",.t.,h2,"A1",.t.)
	var_Items.GroupBars(h1,"A1",.f.,h2,"A1",.f.)
	var_Items.GroupBars(h1,"A2",.t.,h2,"A2",.t.)
	var_Items.GroupBars(h1,"A2",.f.,h2,"A2",.f.)
	var_Items.GroupBars(h1,"A3",.t.,h2,"A3",.t.)
	var_Items.GroupBars(h1,"A3",.f.,h2,"A3",.f.)
oG2antt.EndUpdate()
|
|
1148
|
My skin(EBN) bars are not shown a different color in the overview. What can I do
Dim h as N
Dim oG2antt as P
Dim var_Chart as P
Dim var_Items as P

oG2antt = topparent:CONTROL_ACTIVEX1.activex
oG2antt.BeginUpdate()
oG2antt.VisualAppearance.Add(1,"c:\exontrol\images\normal.ebn")
var_Chart = oG2antt.Chart
	var_Chart.Bars.Item("Task").Color = 16777216
	' var_Chart.PaneWidth(.f.) = 48
	oG2antt.TemplateDef = "dim var_Chart"
	oG2antt.TemplateDef = var_Chart
	oG2antt.Template = "var_Chart.PaneWidth(False) = 48"

	var_Chart.OverviewVisible = 2
	var_Chart.FirstVisibleDate = {01/11/2001}
	var_Chart.LevelCount = 2
oG2antt.Columns.Add("Column")
var_Items = oG2antt.Items
	h = var_Items.AddItem("Task 1")
	var_Items.AddBar(h,"Task",{01/02/2001},{01/04/2001},1)
	var_Items.AddBar(h,"Task",{02/02/2001},{02/04/2001},2)
	' var_Items.ItemBar(h,2,33) = 16776960
	oG2antt.TemplateDef = "dim var_Items,h"
	oG2antt.TemplateDef = var_Items
	oG2antt.TemplateDef = h
	oG2antt.Template = "var_Items.ItemBar(h,2,33) = 16776960"

	h = var_Items.AddItem("Task 2")
	var_Items.AddBar(h,"Task",{02/02/2001},{02/04/2001},"")
	' var_Items.ItemBar(h,"",33) = 255
	oG2antt.TemplateDef = "dim var_Items,h"
	oG2antt.TemplateDef = var_Items
	oG2antt.TemplateDef = h
	oG2antt.Template = "var_Items.ItemBar(h,``,33) = 255"

oG2antt.EndUpdate()
|
|
1147
|
How do I colour the lines in the overview section to match the bars they represent on the main chart
Dim h as N
Dim oG2antt as P
Dim var_Chart as P
Dim var_Items as P

oG2antt = topparent:CONTROL_ACTIVEX1.activex
oG2antt.BeginUpdate()
var_Chart = oG2antt.Chart
	' var_Chart.PaneWidth(.f.) = 48
	oG2antt.TemplateDef = "dim var_Chart"
	oG2antt.TemplateDef = var_Chart
	oG2antt.Template = "var_Chart.PaneWidth(False) = 48"

	var_Chart.OverviewVisible = 2
	var_Chart.FirstVisibleDate = {01/01/2001}
	var_Chart.LevelCount = 2
oG2antt.Columns.Add("Column")
var_Items = oG2antt.Items
	h = var_Items.AddItem("Task 1")
	var_Items.AddBar(h,"Task",{01/02/2001},{01/04/2001},1)
	var_Items.AddBar(h,"Task",{02/02/2001},{02/04/2001},2)
	h = var_Items.AddItem("Task 2")
	var_Items.AddBar(h,"Task",{02/02/2001},{02/04/2001},"")
	' var_Items.ItemBar(h,"",33) = 255
	oG2antt.TemplateDef = "dim var_Items,h"
	oG2antt.TemplateDef = var_Items
	oG2antt.TemplateDef = h
	oG2antt.Template = "var_Items.ItemBar(h,``,33) = 255"

oG2antt.EndUpdate()
|
|
1146
|
How do I catch the delete key (down) on a bar
' Occurs when the user presses a key while an object has the focus.
function KeyDown as v (KeyCode  as  N, Shift  as  N)
	oG2antt = topparent:CONTROL_ACTIVEX1.activex
	? KeyCode
	? Shift
end function

Dim h as N
Dim oG2antt as P
Dim var_Bar as P
Dim var_Chart as P
Dim var_Items as P

oG2antt = topparent:CONTROL_ACTIVEX1.activex
oG2antt.BeginUpdate()
oG2antt.Columns.Add("Task")
var_Chart = oG2antt.Chart
	var_Chart.FirstVisibleDate = {12/27/2000}
	var_Chart.LevelCount = 2
	' var_Chart.PaneWidth(.f.) = 48
	oG2antt.TemplateDef = "dim var_Chart"
	oG2antt.TemplateDef = var_Chart
	oG2antt.Template = "var_Chart.PaneWidth(False) = 48"

	var_Bar = var_Chart.Bars.Item("Task")
		var_Bar.Pattern = 32
		var_Bar.Height = 13
var_Items = oG2antt.Items
	h = var_Items.AddItem("Task 1")
	var_Items.AddBar(h,"Task",{01/02/2001},{01/06/2001},"K1","This is a bit of text that is not clipped")
	h = var_Items.AddItem("Task 1")
	var_Items.AddBar(h,"Task",{01/02/2001},{01/06/2001},"K1","This is a bit of text that get's clipped")
	' var_Items.ItemBar(h,"K1",4) = 3
	oG2antt.TemplateDef = "dim var_Items,h"
	oG2antt.TemplateDef = var_Items
	oG2antt.TemplateDef = h
	oG2antt.Template = "var_Items.ItemBar(h,`K1`,4) = 3"

	' var_Items.ItemBar(h,"K1",6) = var_Items.ItemBar(h,"K1",3)
	oG2antt.TemplateDef = "dim var_Items,h"
	oG2antt.TemplateDef = var_Items
	oG2antt.TemplateDef = h
	oG2antt.Template = "var_Items.ItemBar(h,`K1`,6) = ItemBar(h,`K1`,3)"

oG2antt.EndUpdate()
|
|
1145
|
Is it possible to colour a particular column, I mean the cell's foreground color
Dim oG2antt as P
Dim var_Columns as P
Dim var_ConditionalFormat as P
Dim var_Items as P

oG2antt = topparent:CONTROL_ACTIVEX1.activex
oG2antt.BeginUpdate()
var_ConditionalFormat = oG2antt.ConditionalFormats.Add("1")
	var_ConditionalFormat.ForeColor = 255
	var_ConditionalFormat.ApplyTo = 1 '1 +
oG2antt.MarkSearchColumn = .f.
var_Columns = oG2antt.Columns
	var_Columns.Add("Column 1")
	var_Columns.Add("Column 2")
var_Items = oG2antt.Items
	' var_Items.CellValue(var_Items.AddItem(0),1) = 1
	oG2antt.TemplateDef = "dim var_Items"
	oG2antt.TemplateDef = var_Items
	oG2antt.Template = "var_Items.CellValue(AddItem(0),1) = 1"

	' var_Items.CellValue(var_Items.AddItem(2),1) = 3
	oG2antt.TemplateDef = "dim var_Items"
	oG2antt.TemplateDef = var_Items
	oG2antt.Template = "var_Items.CellValue(AddItem(2),1) = 3"

	' var_Items.CellValue(var_Items.AddItem(4),1) = 5
	oG2antt.TemplateDef = "dim var_Items"
	oG2antt.TemplateDef = var_Items
	oG2antt.Template = "var_Items.CellValue(AddItem(4),1) = 5"

oG2antt.EndUpdate()
|
|
1144
|
Is it possible to colour a particular column for specified values
Dim oG2antt as P
Dim var_Columns as P
Dim var_ConditionalFormat as P
Dim var_Items as P

oG2antt = topparent:CONTROL_ACTIVEX1.activex
oG2antt.BeginUpdate()
var_ConditionalFormat = oG2antt.ConditionalFormats.Add("int(%1) in (3,4,5)")
	var_ConditionalFormat.BackColor = 255
	var_ConditionalFormat.ApplyTo = 1 '1 +
oG2antt.MarkSearchColumn = .f.
var_Columns = oG2antt.Columns
	var_Columns.Add("Column 1")
	var_Columns.Add("Column 2")
var_Items = oG2antt.Items
	' var_Items.CellValue(var_Items.AddItem(0),1) = 1
	oG2antt.TemplateDef = "dim var_Items"
	oG2antt.TemplateDef = var_Items
	oG2antt.Template = "var_Items.CellValue(AddItem(0),1) = 1"

	' var_Items.CellValue(var_Items.AddItem(2),1) = 3
	oG2antt.TemplateDef = "dim var_Items"
	oG2antt.TemplateDef = var_Items
	oG2antt.Template = "var_Items.CellValue(AddItem(2),1) = 3"

	' var_Items.CellValue(var_Items.AddItem(4),1) = 5
	oG2antt.TemplateDef = "dim var_Items"
	oG2antt.TemplateDef = var_Items
	oG2antt.Template = "var_Items.CellValue(AddItem(4),1) = 5"

oG2antt.EndUpdate()
|
|
1143
|
Is it possible to colour a particular column
Dim oG2antt as P
Dim var_Column as local
Dim var_Columns as P
Dim var_Items as P

oG2antt = topparent:CONTROL_ACTIVEX1.activex
oG2antt.BeginUpdate()
oG2antt.MarkSearchColumn = .f.
var_Columns = oG2antt.Columns
	var_Columns.Add("Column 1")
	' var_Columns.Add("Column 2").Def(4) = 255
	var_Column = var_Columns.Add("Column 2")
	oG2antt.TemplateDef = "dim var_Column"
	oG2antt.TemplateDef = var_Column
	oG2antt.Template = "var_Column.Def(4) = 255"

var_Items = oG2antt.Items
	' var_Items.CellValue(var_Items.AddItem(0),1) = 1
	oG2antt.TemplateDef = "dim var_Items"
	oG2antt.TemplateDef = var_Items
	oG2antt.Template = "var_Items.CellValue(AddItem(0),1) = 1"

	' var_Items.CellValue(var_Items.AddItem(2),1) = 3
	oG2antt.TemplateDef = "dim var_Items"
	oG2antt.TemplateDef = var_Items
	oG2antt.Template = "var_Items.CellValue(AddItem(2),1) = 3"

	' var_Items.CellValue(var_Items.AddItem(4),1) = 5
	oG2antt.TemplateDef = "dim var_Items"
	oG2antt.TemplateDef = var_Items
	oG2antt.Template = "var_Items.CellValue(AddItem(4),1) = 5"

oG2antt.EndUpdate()
|
|
1142
|
How do i get all the children items that are under a certain parent Item handle
Dim h as N
Dim hChild as N
Dim oG2antt as P
Dim var_Items as P
Dim var_Items1 as P

oG2antt = topparent:CONTROL_ACTIVEX1.activex
oG2antt.BeginUpdate()
oG2antt.LinesAtRoot = -1
oG2antt.Columns.Add("P")
var_Items = oG2antt.Items
	h = var_Items.AddItem("Root")
	var_Items.InsertItem(h,,"Child 1")
	var_Items.InsertItem(h,,"Child 2")
	' var_Items.ExpandItem(h) = .t.
	oG2antt.TemplateDef = "dim var_Items,h"
	oG2antt.TemplateDef = var_Items
	oG2antt.TemplateDef = h
	oG2antt.Template = "var_Items.ExpandItem(h) = True"

var_Items1 = oG2antt.Items
	hChild = var_Items1.ItemChild(var_Items1.FirstVisibleItem)
	? var_Items1.CellValue(hChild,0)
	? var_Items1.CellValue(var_Items1.NextSiblingItem(hChild),0)
oG2antt.EndUpdate()
|
|
1141
|
How can I access the control's scroll bar so I can change its appearance
Dim oG2antt as P
Dim var_Chart as local

oG2antt = topparent:CONTROL_ACTIVEX1.activex
oG2antt.BeginUpdate()
' oG2antt.Chart.PaneWidth(.f.) = 0
var_Chart = oG2antt.Chart
oG2antt.TemplateDef = "dim var_Chart"
oG2antt.TemplateDef = var_Chart
oG2antt.Template = "var_Chart.PaneWidth(False) = 0"

oG2antt.VisualAppearance.Add(1,"c:\exontrol\images\normal.ebn")
oG2antt.Template = "Background(388) = 16777216" // oG2antt.Background(388) = 16777216
oG2antt.EndUpdate()
|
|
1140
|
How can I show my bars using the parts of the current theme
Dim oG2antt as P
Dim var_Appearance as P
Dim var_Bar as local
Dim var_Bar1 as local
Dim var_Bar2 as local
Dim var_Bar3 as local
Dim var_Bars as P
Dim var_Chart as P
Dim var_Items as P

oG2antt = topparent:CONTROL_ACTIVEX1.activex
oG2antt.BeginUpdate()
var_Appearance = oG2antt.VisualAppearance
	var_Appearance.Add(1,"XP:Button 1 1")
	var_Appearance.Add(2,"XP:Button 1 2")
	var_Appearance.Add(3,"XP:ScrollBar 3 1")
	var_Appearance.Add(4,"XP:ScrollBar 3 2")
var_Chart = oG2antt.Chart
	' var_Chart.PaneWidth(.f.) = 48
	oG2antt.TemplateDef = "dim var_Chart"
	oG2antt.TemplateDef = var_Chart
	oG2antt.Template = "var_Chart.PaneWidth(False) = 48"

	var_Chart.FirstVisibleDate = {01/01/2001}
	var_Bars = var_Chart.Bars
		' var_Bars.Add("B1").Color = 16777216
		var_Bar = var_Bars.Add("B1")
		oG2antt.TemplateDef = "dim var_Bar"
		oG2antt.TemplateDef = var_Bar
		oG2antt.Template = "var_Bar.Color = 16777216"

		' var_Bars.Add("B2").Color = 33554432
		var_Bar1 = var_Bars.Add("B2")
		oG2antt.TemplateDef = "dim var_Bar1"
		oG2antt.TemplateDef = var_Bar1
		oG2antt.Template = "var_Bar1.Color = 33554432"

		' var_Bars.Add("S1").Color = 50331648
		var_Bar2 = var_Bars.Add("S1")
		oG2antt.TemplateDef = "dim var_Bar2"
		oG2antt.TemplateDef = var_Bar2
		oG2antt.Template = "var_Bar2.Color = 50331648"

		' var_Bars.Add("S2").Color = 67108864
		var_Bar3 = var_Bars.Add("S2")
		oG2antt.TemplateDef = "dim var_Bar3"
		oG2antt.TemplateDef = var_Bar3
		oG2antt.Template = "var_Bar3.Color = 67108864"

oG2antt.Columns.Add("Column")
var_Items = oG2antt.Items
	var_Items.AddBar(var_Items.AddItem("Button1"),"B1",{01/02/2001},{01/04/2001})
	var_Items.AddBar(var_Items.AddItem("Button 2"),"B2",{01/02/2001},{01/04/2001})
	var_Items.AddBar(var_Items.AddItem("Scrollbar 1"),"S1",{01/02/2001},{01/04/2001})
	var_Items.AddBar(var_Items.AddItem("Scrollbar 2"),"S2",{01/02/2001},{01/04/2001})
oG2antt.EndUpdate()
|
|
1139
|
How do I hide the text on a bar if the text is to big for the bar length
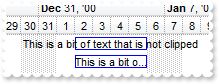
Dim h as N
Dim oG2antt as P
Dim var_Bar as P
Dim var_Chart as P
Dim var_Items as P

oG2antt = topparent:CONTROL_ACTIVEX1.activex
oG2antt.Columns.Add("Task")
var_Chart = oG2antt.Chart
	var_Chart.FirstVisibleDate = {12/27/2000}
	var_Chart.LevelCount = 2
	' var_Chart.PaneWidth(.f.) = 48
	oG2antt.TemplateDef = "dim var_Chart"
	oG2antt.TemplateDef = var_Chart
	oG2antt.Template = "var_Chart.PaneWidth(False) = 48"

	var_Bar = var_Chart.Bars.Item("Task")
		var_Bar.Pattern = 32
		var_Bar.Height = 13
var_Items = oG2antt.Items
	h = var_Items.AddItem("Task 1")
	var_Items.AddBar(h,"Task",{01/02/2001},{01/06/2001},"K1","This is a bit of text that is not clipped")
	h = var_Items.AddItem("Task 1")
	var_Items.AddBar(h,"Task",{01/02/2001},{01/06/2001},"K1","This is a bit of text that get's clipped")
	' var_Items.ItemBar(h,"K1",4) = 3
	oG2antt.TemplateDef = "dim var_Items,h"
	oG2antt.TemplateDef = var_Items
	oG2antt.TemplateDef = h
	oG2antt.Template = "var_Items.ItemBar(h,`K1`,4) = 3"

	' var_Items.ItemBar(h,"K1",6) = var_Items.ItemBar(h,"K1",3)
	oG2antt.TemplateDef = "dim var_Items,h"
	oG2antt.TemplateDef = var_Items
	oG2antt.TemplateDef = h
	oG2antt.Template = "var_Items.ItemBar(h,`K1`,6) = ItemBar(h,`K1`,3)"
|
|
1138
|
Is it possible to change the color for non-working parts of the bar
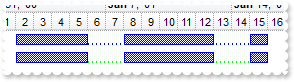
Dim h as N
Dim oG2antt as P
Dim var_Bar as local
Dim var_Chart as P
Dim var_Items as P

oG2antt = topparent:CONTROL_ACTIVEX1.activex
oG2antt.BeginUpdate()
oG2antt.Columns.Add("Task")
var_Chart = oG2antt.Chart
	var_Chart.LevelCount = 2
	' var_Chart.PaneWidth(.f.) = 48
	oG2antt.TemplateDef = "dim var_Chart"
	oG2antt.TemplateDef = var_Chart
	oG2antt.Template = "var_Chart.PaneWidth(False) = 48"

	var_Chart.FirstVisibleDate = {01/01/2001}
	' var_Chart.Bars.Add("Task:Split").Shortcut = "Task"
	var_Bar = var_Chart.Bars.Add("Task:Split")
	oG2antt.TemplateDef = "dim var_Bar"
	oG2antt.TemplateDef = var_Bar
	oG2antt.Template = "var_Bar.Shortcut = `Task`"

	var_Chart.NonworkingDaysColor = 15792880
var_Items = oG2antt.Items
	var_Items.AddBar(var_Items.AddItem("Task 1"),"Task",{01/02/2001},{01/16/2001})
	h = var_Items.AddItem("Task 2")
	var_Items.AddBar(h,"Task",{01/02/2001},{01/16/2001},"")
	' var_Items.ItemBar(h,"",40) = 65280
	oG2antt.TemplateDef = "dim var_Items,h"
	oG2antt.TemplateDef = var_Items
	oG2antt.TemplateDef = h
	oG2antt.Template = "var_Items.ItemBar(h,``,40) = 65280"

oG2antt.EndUpdate()
|
|
1137
|
Is it possible to change the color for the percent bar being displayed inside a specified bar only
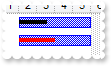
Dim h as N
Dim oG2antt as P
Dim var_Chart as local
Dim var_Items as P

oG2antt = topparent:CONTROL_ACTIVEX1.activex
oG2antt.Columns.Add("Task")
oG2antt.Chart.FirstVisibleDate = {01/01/2001}
oG2antt.Chart.Bars.Add("Task%Progress")
' oG2antt.Chart.PaneWidth(.f.) = 48
var_Chart = oG2antt.Chart
oG2antt.TemplateDef = "dim var_Chart"
oG2antt.TemplateDef = var_Chart
oG2antt.Template = "var_Chart.PaneWidth(False) = 48"

var_Items = oG2antt.Items
	h = var_Items.AddItem("Task 1")
	var_Items.AddBar(h,"Task%Progress",{01/02/2001},{01/06/2001},"K1")
	' var_Items.ItemBar(h,"K1",12) = 0.4
	oG2antt.TemplateDef = "dim var_Items,h"
	oG2antt.TemplateDef = var_Items
	oG2antt.TemplateDef = h
	oG2antt.Template = "var_Items.ItemBar(h,`K1`,12) = 0.4"

	h = var_Items.AddItem("Task 2")
	var_Items.AddBar(h,"Task%Progress",{01/02/2001},{01/06/2001},"K1")
	' var_Items.ItemBar(h,"K1",12) = 0.5
	oG2antt.TemplateDef = "dim var_Items,h"
	oG2antt.TemplateDef = var_Items
	oG2antt.TemplateDef = h
	oG2antt.Template = "var_Items.ItemBar(h,`K1`,12) = 0.5"

	' var_Items.ItemBar(h,"K1",39) = 255
	oG2antt.TemplateDef = "dim var_Items,h"
	oG2antt.TemplateDef = var_Items
	oG2antt.TemplateDef = h
	oG2antt.Template = "var_Items.ItemBar(h,`K1`,39) = 255"
|
|
1136
|
How do I get a handle on the item before adding the bar
Dim h1 as N
Dim h2 as N
Dim h3 as N
Dim oG2antt as P
Dim var_Chart as P
Dim var_Column as local
Dim var_Column1 as local
Dim var_Items as P

oG2antt = topparent:CONTROL_ACTIVEX1.activex
oG2antt.BeginUpdate()
oG2antt.MarkSearchColumn = .f.
oG2antt.OnResizeControl = 1
oG2antt.Columns.Add("Tasks")
' oG2antt.Columns.Add("Start").Visible = .f.
var_Column = oG2antt.Columns.Add("Start")
oG2antt.TemplateDef = "dim var_Column"
oG2antt.TemplateDef = var_Column
oG2antt.Template = "var_Column.Visible = False"

' oG2antt.Columns.Add("End").Visible = .f.
var_Column1 = oG2antt.Columns.Add("End")
oG2antt.TemplateDef = "dim var_Column1"
oG2antt.TemplateDef = var_Column1
oG2antt.Template = "var_Column1.Visible = False"

var_Chart = oG2antt.Chart
	var_Chart.FirstVisibleDate = {09/20/2006}
	' var_Chart.PaneWidth(.f.) = 64
	oG2antt.TemplateDef = "dim var_Chart"
	oG2antt.TemplateDef = var_Chart
	oG2antt.Template = "var_Chart.PaneWidth(0) = 64"

	var_Chart.LevelCount = 2
var_Items = oG2antt.Items
	h1 = var_Items.AddItem("Task 0")
	' var_Items.CellValue(h1,1) = {09/21/2006}
	oG2antt.TemplateDef = "dim var_Items,h1"
	oG2antt.TemplateDef = var_Items
	oG2antt.TemplateDef = h1
	oG2antt.Template = "var_Items.CellValue(h1,1) = #9/21/2006#"

	' var_Items.CellValue(h1,2) = {09/24/2006}
	oG2antt.TemplateDef = "dim var_Items,h1"
	oG2antt.TemplateDef = var_Items
	oG2antt.TemplateDef = h1
	oG2antt.Template = "var_Items.CellValue(h1,2) = #9/24/2006#"

	var_Items.AddBar(h1,"Task",var_Items.CellValue(h1,1),var_Items.CellValue(h1,2))
	h2 = var_Items.InsertItem(h,,"Task 1")
	' var_Items.CellValue(h2,1) = {09/25/2006}
	oG2antt.TemplateDef = "dim var_Items,h2"
	oG2antt.TemplateDef = var_Items
	oG2antt.TemplateDef = h2
	oG2antt.Template = "var_Items.CellValue(h2,1) = #9/25/2006#"

	' var_Items.CellValue(h2,2) = {09/28/2006}
	oG2antt.TemplateDef = "dim var_Items,h2"
	oG2antt.TemplateDef = var_Items
	oG2antt.TemplateDef = h2
	oG2antt.Template = "var_Items.CellValue(h2,2) = #9/28/2006#"

	var_Items.AddBar(h2,"Task",var_Items.CellValue(h2,1),var_Items.CellValue(h2,2))
	h3 = var_Items.InsertItem(h,,"Task 2")
	' var_Items.CellValue(h3,1) = {09/29/2006}
	oG2antt.TemplateDef = "dim var_Items,h3"
	oG2antt.TemplateDef = var_Items
	oG2antt.TemplateDef = h3
	oG2antt.Template = "var_Items.CellValue(h3,1) = #9/29/2006#"

	' var_Items.CellValue(h3,2) = {10/02/2006}
	oG2antt.TemplateDef = "dim var_Items,h3"
	oG2antt.TemplateDef = var_Items
	oG2antt.TemplateDef = h3
	oG2antt.Template = "var_Items.CellValue(h3,2) = #10/2/2006#"

	var_Items.AddBar(h3,"Task",var_Items.CellValue(h3,1),var_Items.CellValue(h3,2))
	var_Items.AddItem(var_Items.ItemCount)
oG2antt.EndUpdate()
|
|
1135
|
Is there an Items method that I can use to loop around to compare the item's user data against
Dim h as N
Dim oG2antt as P
Dim var_Items as P

oG2antt = topparent:CONTROL_ACTIVEX1.activex
oG2antt.Columns.Add("Default")
var_Items = oG2antt.Items
	h = var_Items.AddItem("Root 1")
	var_Items.InsertItem(h,,"Child 1")
	' var_Items.ItemData(var_Items.InsertItem(h,,"Child 2")) = 1234
	oG2antt.TemplateDef = "dim var_Items"
	oG2antt.TemplateDef = var_Items
	oG2antt.Template = "var_Items.ItemData(InsertItem(h,,`Child 2`)) = 1234"

	' var_Items.ExpandItem(h) = .t.
	oG2antt.TemplateDef = "dim var_Items,h"
	oG2antt.TemplateDef = var_Items
	oG2antt.TemplateDef = h
	oG2antt.Template = "var_Items.ExpandItem(h) = True"

	' var_Items.ItemBold(var_Items.FindItemData(1234)) = .t.
	oG2antt.TemplateDef = "dim var_Items"
	oG2antt.TemplateDef = var_Items
	oG2antt.Template = "var_Items.ItemBold(FindItemData(1234)) = True"
|
|
1134
|
How do I make the tooltip box wider to allow for longer text
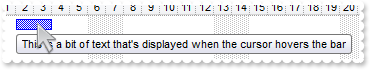
Dim h as N
Dim oG2antt as P
Dim var_Chart as P
Dim var_Items as P

oG2antt = topparent:CONTROL_ACTIVEX1.activex
oG2antt.ToolTipWidth = 328
oG2antt.Columns.Add("Task")
var_Chart = oG2antt.Chart
	var_Chart.FirstVisibleDate = {01/01/2001}
	' var_Chart.PaneWidth(.f.) = 48
	oG2antt.TemplateDef = "dim var_Chart"
	oG2antt.TemplateDef = var_Chart
	oG2antt.Template = "var_Chart.PaneWidth(False) = 48"

var_Items = oG2antt.Items
	h = var_Items.AddItem("Task 1")
	var_Items.AddBar(h,"Task",{01/02/2001},{01/04/2001},"K1")
	' var_Items.ItemBar(h,"K1",6) = "This is a bit of text that's displayed when the cursor hovers the bar"
	oG2antt.TemplateDef = "dim var_Items,h"
	oG2antt.TemplateDef = var_Items
	oG2antt.TemplateDef = h
	oG2antt.Template = "var_Items.ItemBar(h,`K1`,6) = `This is a bit of text that's displayed when the cursor hovers the bar`"
|
|
1133
|
How do i set the default timeslots to say hours or minutes
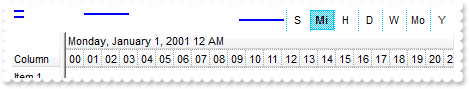
Dim oG2antt as P
Dim var_Chart as P
Dim var_Items as P
oG2antt = topparent:CONTROL_ACTIVEX1.activex
oG2antt.BeginUpdate()
var_Chart = oG2antt.Chart
var_Chart.FirstVisibleDate = {01/01/2001}
' var_Chart.PaneWidth(.f.) = 48
oG2antt.TemplateDef = "dim var_Chart"
oG2antt.TemplateDef = var_Chart
oG2antt.Template = "var_Chart.PaneWidth(False) = 48"
var_Chart.OverviewVisible = 2
var_Chart.LevelCount = 2
var_Chart.AllowOverviewZoom = 1
var_Chart.OverviewZoomUnit = 24
var_Chart.OverviewZoomCaption = "Y|�Y|�Y|Mo|T|W|D|H|Mi|S"
var_Chart.UnitScale = 1048576
oG2antt.Columns.Add("Column")
var_Items = oG2antt.Items
var_Items.AddBar(var_Items.AddItem("Item 1"),"Task",{01/02/2001},{01/04/2001})
var_Items.AddBar(var_Items.AddItem("Item 2"),"Task",{01/16/2001},{01/25/2001})
var_Items.AddBar(var_Items.AddItem("Item 3"),"Task",{01/02/2001},{01/04/2001})
var_Items.AddBar(var_Items.AddItem("Item 4"),"Task",{02/16/2001},{02/25/2001})
oG2antt.EndUpdate()
|
|
1132
|
Can I use icons or images in the text in the overview zoom buttons (Sec., Min., Hour, Month...)
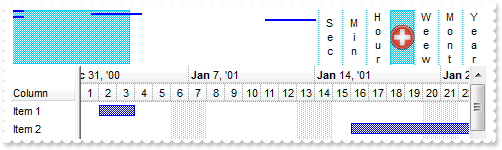
Dim oG2antt as P
Dim var_Chart as P
Dim var_Items as P
oG2antt = topparent:CONTROL_ACTIVEX1.activex
oG2antt.BeginUpdate()
oG2antt.Template = "HTMLPicture(`pic1`) = `c:\exontrol\images\zipdisk.gif`" // oG2antt.HTMLPicture("pic1") = "c:\exontrol\images\zipdisk.gif"
var_Chart = oG2antt.Chart
var_Chart.FirstVisibleDate = {01/01/2001}
' var_Chart.PaneWidth(.f.) = 48
oG2antt.TemplateDef = "dim var_Chart"
oG2antt.TemplateDef = var_Chart
oG2antt.Template = "var_Chart.PaneWidth(False) = 48"
var_Chart.OverviewVisible = 2
var_Chart.LevelCount = 2
var_Chart.AllowOverviewZoom = 1
var_Chart.OverviewZoomUnit = 24
var_Chart.OverviewHeight = 58
var_Chart.OverviewZoomCaption = "Y<br>e<br>a<br>r|�Y|�Y|M<br>o<br>n<br>t<br>h|T|W<br>e<br>e<br>w|<img>pic1:28<img>|H<br>o<br>u<br>r|M<br>i<br>n|S<br>e<br>c"
oG2antt.Columns.Add("Column")
var_Items = oG2antt.Items
var_Items.AddBar(var_Items.AddItem("Item 1"),"Task",{01/02/2001},{01/04/2001})
var_Items.AddBar(var_Items.AddItem("Item 2"),"Task",{01/16/2001},{01/25/2001})
var_Items.AddBar(var_Items.AddItem("Item 3"),"Task",{01/02/2001},{01/04/2001})
var_Items.AddBar(var_Items.AddItem("Item 4"),"Task",{02/16/2001},{02/25/2001})
oG2antt.EndUpdate()
|
|
1131
|
Can I use icons or images in the text in the overview zoom buttons (Sec., Min., Hour, Month...)
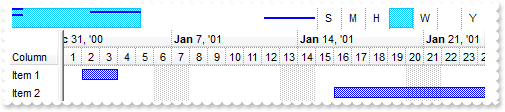
Dim oG2antt as P
Dim var_Chart as P
Dim var_Items as P
oG2antt = topparent:CONTROL_ACTIVEX1.activex
oG2antt.BeginUpdate()
oG2antt.Images("gBJJgBAIDAAGAAEAAQhYAf8Pf4hh0QihCJo2AEZjQAjEZFEaIEaEEaAIAkcbk0olUrlktl0vmExmUzmk1m03nE5nU7nk9n0/oFBoVDolFo1HpFJpVLplNp1PqFRqVTqlVq1XrFZrVbrldr1fsFhsVjslls1ntFptVrtltt1vuFxuVzul1u13vF5vV7vl9v1/wGBwWDwmFw2HxGJxWLxmNx0xiFdyOTh8Tf9ZymXx+QytcyNgz8r0OblWjyWds+m0ka1Vf1ta1+r1mos2xrG2xeZ0+a0W0qOx3GO4NV3WeyvD2XJ5XL5nN51aiw+lfSj0gkUkAEllHanHI5j/cHg8EZf7w8vl8j4f/qfEZeB09/vjLAB30+kZQAP/P5/H6/yNAOAEAwCjMBwFAEDwJBMDwLBYAP2/8Hv8/gAGAD8LQs9w/nhDY/oygIA=")
var_Chart = oG2antt.Chart
var_Chart.FirstVisibleDate = {01/01/2001}
' var_Chart.PaneWidth(.f.) = 48
oG2antt.TemplateDef = "dim var_Chart"
oG2antt.TemplateDef = var_Chart
oG2antt.Template = "var_Chart.PaneWidth(False) = 48"
var_Chart.OverviewVisible = 2
var_Chart.LevelCount = 2
var_Chart.AllowOverviewZoom = 1
var_Chart.OverviewZoomUnit = 24
var_Chart.OverviewZoomCaption = "Y|�Y|�Y|<img>2<img>|T|W|<img>1<img>|H|M|S"
oG2antt.Columns.Add("Column")
var_Items = oG2antt.Items
var_Items.AddBar(var_Items.AddItem("Item 1"),"Task",{01/02/2001},{01/04/2001})
var_Items.AddBar(var_Items.AddItem("Item 2"),"Task",{01/16/2001},{01/25/2001})
var_Items.AddBar(var_Items.AddItem("Item 3"),"Task",{01/02/2001},{01/04/2001})
var_Items.AddBar(var_Items.AddItem("Item 4"),"Task",{02/16/2001},{02/25/2001})
oG2antt.EndUpdate()
|
|
1130
|
How do I change (for localisation) the text in the buttons like (Sec., Min., Hour, Month...)
Dim oG2antt as P
Dim var_Chart as P
Dim var_Items as P
oG2antt = topparent:CONTROL_ACTIVEX1.activex
oG2antt.BeginUpdate()
var_Chart = oG2antt.Chart
var_Chart.FirstVisibleDate = {01/01/2001}
' var_Chart.PaneWidth(.f.) = 48
oG2antt.TemplateDef = "dim var_Chart"
oG2antt.TemplateDef = var_Chart
oG2antt.Template = "var_Chart.PaneWidth(False) = 48"
var_Chart.OverviewVisible = 2
var_Chart.LevelCount = 2
var_Chart.AllowOverviewZoom = 1
var_Chart.OverviewZoomUnit = 24
var_Chart.OverviewZoomCaption = "Y|�Y|�Y|Mo|T|W|D|H|Mi|S"
oG2antt.Columns.Add("Column")
var_Items = oG2antt.Items
var_Items.AddBar(var_Items.AddItem("Item 1"),"Task",{01/02/2001},{01/04/2001})
var_Items.AddBar(var_Items.AddItem("Item 2"),"Task",{01/16/2001},{01/25/2001})
var_Items.AddBar(var_Items.AddItem("Item 3"),"Task",{01/02/2001},{01/04/2001})
var_Items.AddBar(var_Items.AddItem("Item 4"),"Task",{02/16/2001},{02/25/2001})
oG2antt.EndUpdate()
|
|
1129
|
How I can change the Months and Weekdays
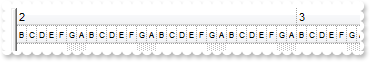
Dim oG2antt as P
Dim var_Chart as P
Dim var_Level as P
Dim var_Level1 as P

oG2antt = topparent:CONTROL_ACTIVEX1.activex
oG2antt.BeginUpdate()
var_Chart = oG2antt.Chart
	' var_Chart.PaneWidth(.f.) = 0
	oG2antt.TemplateDef = "dim var_Chart"
	oG2antt.TemplateDef = var_Chart
	oG2antt.Template = "var_Chart.PaneWidth(False) = 0"

	var_Chart.FirstVisibleDate = {02/01/2010}
	var_Chart.LevelCount = 2
	var_Chart.UnitWidth = 10
	var_Chart.MonthNames = "1 2 3 4 5 6 7 8 9 10 11 12"
	var_Chart.WeekDays = "A B C D E F G"
	var_Level = var_Chart.Level(0)
		var_Level.Label = "<%mmmm%>"
		var_Level.Unit = 16
	var_Level1 = var_Chart.Level(1)
		var_Level1.Label = "<font ;6><%ddd%>"
		var_Level1.Unit = 4096
oG2antt.EndUpdate()
|
|
1128
|
How do i get the current window time frame (the start and end) of the gantt chart
' Occurs when the first visible date is changed.
function DateChange as v ()
	Dim var_Chart as P
	oG2antt = topparent:CONTROL_ACTIVEX1.activex
	var_Chart = oG2antt.Chart
		? "Start"
		? var_Chart.FirstVisibleDate
		? ""
		? "End"
		? var_Chart.DateFromPoint(var_Chart.PaneWidth(.t.),0)
end function

Dim oG2antt as P
Dim var_Chart as P

oG2antt = topparent:CONTROL_ACTIVEX1.activex
oG2antt.BeginUpdate()
var_Chart = oG2antt.Chart
	' var_Chart.PaneWidth(.f.) = 1
	oG2antt.TemplateDef = "dim var_Chart"
	oG2antt.TemplateDef = var_Chart
	oG2antt.Template = "var_Chart.PaneWidth(False) = 1"

	var_Chart.LevelCount = 2
	var_Chart.ScrollTo({01/01/2010},0)
oG2antt.EndUpdate()
|
|
1127
|
When I use this Chart.get_DateFromPoint(exg2antt1.Width, 0) I get date as 0, 30/12/1899, or 12:00:00 AM. What that means
' Occurs when the user moves the mouse.
function MouseMove as v (Button  as  N, Shift  as  N, X  as  OLE::Exontrol.G2antt.1::OLE_XPOS_PIXELS, Y  as  OLE::Exontrol.G2antt.1::OLE_YPOS_PIXELS)
	oG2antt = topparent:CONTROL_ACTIVEX1.activex
	? oG2antt.Chart.DateFromPoint(-1,-1)
end function

Dim oG2antt as P
Dim var_Chart as P

oG2antt = topparent:CONTROL_ACTIVEX1.activex
var_Chart = oG2antt.Chart
	' var_Chart.PaneWidth(.f.) = 48
	oG2antt.TemplateDef = "dim var_Chart"
	oG2antt.TemplateDef = var_Chart
	oG2antt.Template = "var_Chart.PaneWidth(False) = 48"

	var_Chart.LevelCount = 2
|
|
1126
|
How do I enable grabing bars to other items/rows (and only enable them to be dropped on certain rows)
' Occurs just before moving a bar from current item to another item.
function BarParentChange as v (Item  as  OLE::Exontrol.G2antt.1::HITEM, Key  as  A, NewItem  as  OLE::Exontrol.G2antt.1::HITEM, Cancel  as  L)
	oG2antt = topparent:CONTROL_ACTIVEX1.activex
	? oG2antt.Items.CellCaption(NewItem,0)
	Cancel = oG2antt.Items.ItemData(NewItem)
end function

Dim h as N
Dim oG2antt as P
Dim var_Chart as P
Dim var_Items as P

oG2antt = topparent:CONTROL_ACTIVEX1.activex
oG2antt.BeginUpdate()
var_Chart = oG2antt.Chart
	var_Chart.FirstVisibleDate = {01/01/2001}
	' var_Chart.PaneWidth(.f.) = 48
	oG2antt.TemplateDef = "dim var_Chart"
	oG2antt.TemplateDef = var_Chart
	oG2antt.Template = "var_Chart.PaneWidth(False) = 48"

	var_Chart.AllowLinkBars = .f.
	var_Chart.Bars.Item("Task").OverlaidType = 257 'exOverlaidBarsTransparent + exOverlaidBarsOffset
oG2antt.Columns.Add("Column")
var_Items = oG2antt.Items
	h = var_Items.AddItem("Item 1")
	' var_Items.EnableItem(h) = .f.
	oG2antt.TemplateDef = "dim var_Items,h"
	oG2antt.TemplateDef = var_Items
	oG2antt.TemplateDef = h
	oG2antt.Template = "var_Items.EnableItem(h) = False"

	' var_Items.ItemData(h) = -1
	oG2antt.TemplateDef = "dim var_Items,h"
	oG2antt.TemplateDef = var_Items
	oG2antt.TemplateDef = h
	oG2antt.Template = "var_Items.ItemData(h) = -1"

	h = var_Items.AddItem("Item 2")
	' var_Items.ItemData(h) = 0
	oG2antt.TemplateDef = "dim var_Items,h"
	oG2antt.TemplateDef = var_Items
	oG2antt.TemplateDef = h
	oG2antt.Template = "var_Items.ItemData(h) = 0"

	var_Items.AddBar(h,"Task",{01/05/2001},{01/07/2001},"B")
	' var_Items.ItemBar(h,"B",28) = .t.
	oG2antt.TemplateDef = "dim var_Items,h"
	oG2antt.TemplateDef = var_Items
	oG2antt.TemplateDef = h
	oG2antt.Template = "var_Items.ItemBar(h,`B`,28) = True"

	' var_Items.ItemData(var_Items.AddItem("Item 3")) = 0
	oG2antt.TemplateDef = "dim var_Items"
	oG2antt.TemplateDef = var_Items
	oG2antt.Template = "var_Items.ItemData(AddItem(`Item 3`)) = 0"

	h = var_Items.AddItem("Item 4")
	' var_Items.EnableItem(h) = .f.
	oG2antt.TemplateDef = "dim var_Items,h"
	oG2antt.TemplateDef = var_Items
	oG2antt.TemplateDef = h
	oG2antt.Template = "var_Items.EnableItem(h) = False"

	' var_Items.ItemData(h) = -1
	oG2antt.TemplateDef = "dim var_Items,h"
	oG2antt.TemplateDef = var_Items
	oG2antt.TemplateDef = h
	oG2antt.Template = "var_Items.ItemData(h) = -1"

oG2antt.EndUpdate()
|
|
1125
|
How can I find out if a date time is a non-working part
' Occurs when the user moves the mouse.
function MouseMove as v (Button  as  N, Shift  as  N, X  as  OLE::Exontrol.G2antt.1::OLE_XPOS_PIXELS, Y  as  OLE::Exontrol.G2antt.1::OLE_YPOS_PIXELS)
	Dim d as
	Dim h as N
	oG2antt = topparent:CONTROL_ACTIVEX1.activex
	h = oG2antt.ItemFromPoint(-1,-1,c,hit)
	d = oG2antt.Chart.DateFromPoint(-1,-1)
	? d
	? oG2antt.Chart.IsNonworkingDate(d,h)
end function

Dim h as N
Dim oG2antt as P
Dim var_Chart as P
Dim var_Items as P

oG2antt = topparent:CONTROL_ACTIVEX1.activex
oG2antt.BeginUpdate()
oG2antt.Columns.Add("NonWorking")
var_Chart = oG2antt.Chart
	var_Chart.FirstWeekDay = 1
	var_Chart.FirstVisibleDate = {01/24/2008}
	' var_Chart.PaneWidth(.f.) = 64
	oG2antt.TemplateDef = "dim var_Chart"
	oG2antt.TemplateDef = var_Chart
	oG2antt.Template = "var_Chart.PaneWidth(False) = 64"

	var_Chart.LevelCount = 2
var_Items = oG2antt.Items
	h = var_Items.AddItem("Default")
	h = var_Items.AddItem("January")
	' var_Items.ItemNonworkingUnits(h,.f.) = "month(value) = 1"
	oG2antt.TemplateDef = "dim var_Items,h"
	oG2antt.TemplateDef = var_Items
	oG2antt.TemplateDef = h
	oG2antt.Template = "var_Items.ItemNonworkingUnits(h,False) = `month(value) = 1`"

	h = var_Items.AddItem("February, Saturday, Sunday")
	' var_Items.ItemNonworkingUnits(h,.f.) = "month(value) = 2 or (weekday(value) = 0 or weekday(value) = 6)"
	oG2antt.TemplateDef = "dim var_Items,h"
	oG2antt.TemplateDef = var_Items
	oG2antt.TemplateDef = h
	oG2antt.Template = "var_Items.ItemNonworkingUnits(h,False) = `month(value) = 2 or (weekday(value) = 0 or weekday(value) = 6)`"

	h = var_Items.AddItem("Sunday")
	' var_Items.ItemNonworkingUnits(h,.f.) = "weekday(value) = 0"
	oG2antt.TemplateDef = "dim var_Items,h"
	oG2antt.TemplateDef = var_Items
	oG2antt.TemplateDef = h
	oG2antt.Template = "var_Items.ItemNonworkingUnits(h,False) = `weekday(value) = 0`"

oG2antt.EndUpdate()
|
|
1124
|
I am using the ItemBar property exBarCanMoveToAnother, How do I stop it from being dropped on certain chart rows
' Occurs just before moving a bar from current item to another item.
function BarParentChange as v (Item  as  OLE::Exontrol.G2antt.1::HITEM, Key  as  A, NewItem  as  OLE::Exontrol.G2antt.1::HITEM, Cancel  as  L)
	oG2antt = topparent:CONTROL_ACTIVEX1.activex
	? oG2antt.Items.CellCaption(NewItem,0)
	Cancel = oG2antt.Items.ItemData(NewItem)
end function

Dim h as N
Dim oG2antt as P
Dim var_Chart as P
Dim var_Items as P

oG2antt = topparent:CONTROL_ACTIVEX1.activex
oG2antt.BeginUpdate()
var_Chart = oG2antt.Chart
	var_Chart.FirstVisibleDate = {01/01/2001}
	' var_Chart.PaneWidth(.f.) = 48
	oG2antt.TemplateDef = "dim var_Chart"
	oG2antt.TemplateDef = var_Chart
	oG2antt.Template = "var_Chart.PaneWidth(False) = 48"

	var_Chart.AllowLinkBars = .f.
	var_Chart.Bars.Item("Task").OverlaidType = 257 'exOverlaidBarsTransparent + exOverlaidBarsOffset
oG2antt.Columns.Add("Column")
var_Items = oG2antt.Items
	h = var_Items.AddItem("Item 1")
	' var_Items.EnableItem(h) = .f.
	oG2antt.TemplateDef = "dim var_Items,h"
	oG2antt.TemplateDef = var_Items
	oG2antt.TemplateDef = h
	oG2antt.Template = "var_Items.EnableItem(h) = False"

	' var_Items.ItemData(h) = -1
	oG2antt.TemplateDef = "dim var_Items,h"
	oG2antt.TemplateDef = var_Items
	oG2antt.TemplateDef = h
	oG2antt.Template = "var_Items.ItemData(h) = -1"

	h = var_Items.AddItem("Item 2")
	' var_Items.ItemData(h) = 0
	oG2antt.TemplateDef = "dim var_Items,h"
	oG2antt.TemplateDef = var_Items
	oG2antt.TemplateDef = h
	oG2antt.Template = "var_Items.ItemData(h) = 0"

	var_Items.AddBar(h,"Task",{01/05/2001},{01/07/2001},"B")
	' var_Items.ItemBar(h,"B",28) = .t.
	oG2antt.TemplateDef = "dim var_Items,h"
	oG2antt.TemplateDef = var_Items
	oG2antt.TemplateDef = h
	oG2antt.Template = "var_Items.ItemBar(h,`B`,28) = True"

	' var_Items.ItemData(var_Items.AddItem("Item 3")) = 0
	oG2antt.TemplateDef = "dim var_Items"
	oG2antt.TemplateDef = var_Items
	oG2antt.Template = "var_Items.ItemData(AddItem(`Item 3`)) = 0"

	' var_Items.ItemData(var_Items.AddItem("Item 4")) = 0
	oG2antt.TemplateDef = "dim var_Items"
	oG2antt.TemplateDef = var_Items
	oG2antt.Template = "var_Items.ItemData(AddItem(`Item 4`)) = 0"

oG2antt.EndUpdate()
|
|
1123
|
What is the event I should use to capture the click event on the task item on left hand side
' Occurs when the user presses and then releases the left mouse button over the tree control.
function Click as v ()
	Dim h as N
	oG2antt = topparent:CONTROL_ACTIVEX1.activex
	h = oG2antt.ItemFromPoint(-1,-1,c,hit)
	? oG2antt.Items.CellCaption(h,c)
end function

Dim h as N
Dim oG2antt as P
Dim var_Items as P

oG2antt = topparent:CONTROL_ACTIVEX1.activex
oG2antt.BeginUpdate()
oG2antt.LinesAtRoot = -1
oG2antt.Columns.Add("Items")
var_Items = oG2antt.Items
	h = var_Items.AddItem("R1")
	var_Items.InsertItem(h,,"Cell 1.1")
	var_Items.InsertItem(h,,"Cell 1.2")
	' var_Items.ExpandItem(h) = .t.
	oG2antt.TemplateDef = "dim var_Items,h"
	oG2antt.TemplateDef = var_Items
	oG2antt.TemplateDef = h
	oG2antt.Template = "var_Items.ExpandItem(h) = True"

	h = var_Items.AddItem("R2")
	var_Items.InsertItem(h,,"Cell 2.1")
	var_Items.InsertItem(h,,"Cell 2.2")
	' var_Items.ExpandItem(h) = .t.
	oG2antt.TemplateDef = "dim var_Items,h"
	oG2antt.TemplateDef = var_Items
	oG2antt.TemplateDef = h
	oG2antt.Template = "var_Items.ExpandItem(h) = True"

oG2antt.EndUpdate()
|
|
1122
|
Can I add a hyperlink assigned to a bar
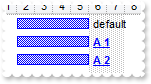
' Occurs when an anchor element is clicked.
function AnchorClick as v (AnchorID  as  C, Options  as  C)
	oG2antt = topparent:CONTROL_ACTIVEX1.activex
	? AnchorID
end function

Dim h as N
Dim oG2antt as P
Dim var_Chart as P
Dim var_Items as P

oG2antt = topparent:CONTROL_ACTIVEX1.activex
oG2antt.BeginUpdate()
oG2antt.Columns.Add("Task")
var_Chart = oG2antt.Chart
	var_Chart.FirstVisibleDate = {01/01/2001}
	' var_Chart.PaneWidth(.f.) = 48
	oG2antt.TemplateDef = "dim var_Chart"
	oG2antt.TemplateDef = var_Chart
	oG2antt.Template = "var_Chart.PaneWidth(False) = 48"

var_Items = oG2antt.Items
	h = var_Items.AddItem("Task 1")
	var_Items.AddBar(h,"Task",{01/02/2001},{01/06/2001},"K")
	' var_Items.ItemBar(h,"K",3) = "default"
	oG2antt.TemplateDef = "dim var_Items,h"
	oG2antt.TemplateDef = var_Items
	oG2antt.TemplateDef = h
	oG2antt.Template = "var_Items.ItemBar(h,`K`,3) = `default`"

	' var_Items.ItemBar(h,"K",4) = 18
	oG2antt.TemplateDef = "dim var_Items,h"
	oG2antt.TemplateDef = var_Items
	oG2antt.TemplateDef = h
	oG2antt.Template = "var_Items.ItemBar(h,`K`,4) = 18"

	h = var_Items.AddItem("Task 2")
	var_Items.AddBar(h,"Task",{01/02/2001},{01/06/2001},"K")
	' var_Items.ItemBar(h,"K",3) = "<a1><b>A 1</b></a>"
	oG2antt.TemplateDef = "dim var_Items,h"
	oG2antt.TemplateDef = var_Items
	oG2antt.TemplateDef = h
	oG2antt.Template = "var_Items.ItemBar(h,`K`,3) = `<a1><b>A 1</b></a>`"

	' var_Items.ItemBar(h,"K",4) = 18
	oG2antt.TemplateDef = "dim var_Items,h"
	oG2antt.TemplateDef = var_Items
	oG2antt.TemplateDef = h
	oG2antt.Template = "var_Items.ItemBar(h,`K`,4) = 18"

	h = var_Items.AddItem("Task 3")
	var_Items.AddBar(h,"Task",{01/02/2001},{01/06/2001},"K")
	' var_Items.ItemBar(h,"K",3) = "<a2><b>A 2</b></a>"
	oG2antt.TemplateDef = "dim var_Items,h"
	oG2antt.TemplateDef = var_Items
	oG2antt.TemplateDef = h
	oG2antt.Template = "var_Items.ItemBar(h,`K`,3) = `<a2><b>A 2</b></a>`"

	' var_Items.ItemBar(h,"K",4) = 18
	oG2antt.TemplateDef = "dim var_Items,h"
	oG2antt.TemplateDef = var_Items
	oG2antt.TemplateDef = h
	oG2antt.Template = "var_Items.ItemBar(h,`K`,4) = 18"

oG2antt.EndUpdate()
|
|
1121
|
Can I change the background color only for the text (caption) in a bar
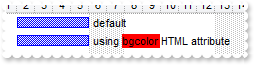
Dim h as N
Dim oG2antt as P
Dim var_Chart as P
Dim var_Items as P

oG2antt = topparent:CONTROL_ACTIVEX1.activex
oG2antt.BeginUpdate()
oG2antt.Columns.Add("Task")
var_Chart = oG2antt.Chart
	var_Chart.FirstVisibleDate = {01/01/2001}
	' var_Chart.PaneWidth(.f.) = 48
	oG2antt.TemplateDef = "dim var_Chart"
	oG2antt.TemplateDef = var_Chart
	oG2antt.Template = "var_Chart.PaneWidth(False) = 48"

var_Items = oG2antt.Items
	h = var_Items.AddItem("Task 1")
	var_Items.AddBar(h,"Task",{01/02/2001},{01/06/2001},"K")
	' var_Items.ItemBar(h,"K",3) = "default"
	oG2antt.TemplateDef = "dim var_Items,h"
	oG2antt.TemplateDef = var_Items
	oG2antt.TemplateDef = h
	oG2antt.Template = "var_Items.ItemBar(h,`K`,3) = `default`"

	' var_Items.ItemBar(h,"K",4) = 18
	oG2antt.TemplateDef = "dim var_Items,h"
	oG2antt.TemplateDef = var_Items
	oG2antt.TemplateDef = h
	oG2antt.Template = "var_Items.ItemBar(h,`K`,4) = 18"

	h = var_Items.AddItem("Task 2")
	var_Items.AddBar(h,"Task",{01/02/2001},{01/06/2001},"K")
	' var_Items.ItemBar(h,"K",3) = "using <bgcolor=FF0000>bgcolor</bgcolor> HTML attribute "
	oG2antt.TemplateDef = "dim var_Items,h"
	oG2antt.TemplateDef = var_Items
	oG2antt.TemplateDef = h
	oG2antt.Template = "var_Items.ItemBar(h,`K`,3) = `using <bgcolor=FF0000>bgcolor</bgcolor> HTML attribute `"

	' var_Items.ItemBar(h,"K",4) = 18
	oG2antt.TemplateDef = "dim var_Items,h"
	oG2antt.TemplateDef = var_Items
	oG2antt.TemplateDef = h
	oG2antt.Template = "var_Items.ItemBar(h,`K`,4) = 18"

oG2antt.EndUpdate()
|
|
1120
|
Can I change the font to display the text (caption) in a bar
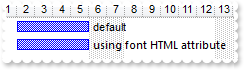
Dim h as N
Dim oG2antt as P
Dim var_Chart as P
Dim var_Items as P

oG2antt = topparent:CONTROL_ACTIVEX1.activex
oG2antt.BeginUpdate()
oG2antt.Columns.Add("Task")
var_Chart = oG2antt.Chart
	var_Chart.FirstVisibleDate = {01/01/2001}
	' var_Chart.PaneWidth(.f.) = 48
	oG2antt.TemplateDef = "dim var_Chart"
	oG2antt.TemplateDef = var_Chart
	oG2antt.Template = "var_Chart.PaneWidth(False) = 48"

var_Items = oG2antt.Items
	h = var_Items.AddItem("Task 1")
	var_Items.AddBar(h,"Task",{01/02/2001},{01/06/2001},"K")
	' var_Items.ItemBar(h,"K",3) = "default"
	oG2antt.TemplateDef = "dim var_Items,h"
	oG2antt.TemplateDef = var_Items
	oG2antt.TemplateDef = h
	oG2antt.Template = "var_Items.ItemBar(h,`K`,3) = `default`"

	' var_Items.ItemBar(h,"K",4) = 18
	oG2antt.TemplateDef = "dim var_Items,h"
	oG2antt.TemplateDef = var_Items
	oG2antt.TemplateDef = h
	oG2antt.Template = "var_Items.ItemBar(h,`K`,4) = 18"

	h = var_Items.AddItem("Task 2")
	var_Items.AddBar(h,"Task",{01/02/2001},{01/06/2001},"K")
	' var_Items.ItemBar(h,"K",3) = "<font Segoe UI;8 >using font HTML attribute </fgcolor>"
	oG2antt.TemplateDef = "dim var_Items,h"
	oG2antt.TemplateDef = var_Items
	oG2antt.TemplateDef = h
	oG2antt.Template = "var_Items.ItemBar(h,`K`,3) = `<font Segoe UI;8 >using font HTML attribute </fgcolor>`"

	' var_Items.ItemBar(h,"K",4) = 18
	oG2antt.TemplateDef = "dim var_Items,h"
	oG2antt.TemplateDef = var_Items
	oG2antt.TemplateDef = h
	oG2antt.Template = "var_Items.ItemBar(h,`K`,4) = 18"

oG2antt.EndUpdate()
|
|
1119
|
How do i change the forecolor of text (caption) in a bar
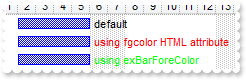
Dim h as N
Dim oG2antt as P
Dim var_Chart as P
Dim var_Items as P

oG2antt = topparent:CONTROL_ACTIVEX1.activex
oG2antt.BeginUpdate()
oG2antt.Columns.Add("Task")
var_Chart = oG2antt.Chart
	var_Chart.FirstVisibleDate = {01/01/2001}
	' var_Chart.PaneWidth(.f.) = 48
	oG2antt.TemplateDef = "dim var_Chart"
	oG2antt.TemplateDef = var_Chart
	oG2antt.Template = "var_Chart.PaneWidth(False) = 48"

var_Items = oG2antt.Items
	h = var_Items.AddItem("Task 1")
	var_Items.AddBar(h,"Task",{01/02/2001},{01/06/2001},"K")
	' var_Items.ItemBar(h,"K",3) = "default"
	oG2antt.TemplateDef = "dim var_Items,h"
	oG2antt.TemplateDef = var_Items
	oG2antt.TemplateDef = h
	oG2antt.Template = "var_Items.ItemBar(h,`K`,3) = `default`"

	' var_Items.ItemBar(h,"K",4) = 18
	oG2antt.TemplateDef = "dim var_Items,h"
	oG2antt.TemplateDef = var_Items
	oG2antt.TemplateDef = h
	oG2antt.Template = "var_Items.ItemBar(h,`K`,4) = 18"

	h = var_Items.AddItem("Task 2")
	var_Items.AddBar(h,"Task",{01/02/2001},{01/06/2001},"K")
	' var_Items.ItemBar(h,"K",3) = "<fgcolor=FF0000>using fgcolor HTML attribute </fgcolor>"
	oG2antt.TemplateDef = "dim var_Items,h"
	oG2antt.TemplateDef = var_Items
	oG2antt.TemplateDef = h
	oG2antt.Template = "var_Items.ItemBar(h,`K`,3) = `<fgcolor=FF0000>using fgcolor HTML attribute </fgcolor>`"

	' var_Items.ItemBar(h,"K",4) = 18
	oG2antt.TemplateDef = "dim var_Items,h"
	oG2antt.TemplateDef = var_Items
	oG2antt.TemplateDef = h
	oG2antt.Template = "var_Items.ItemBar(h,`K`,4) = 18"

	h = var_Items.AddItem("Task 3")
	var_Items.AddBar(h,"Task",{01/02/2001},{01/06/2001},"K")
	' var_Items.ItemBar(h,"K",3) = "using exBarForeColor"
	oG2antt.TemplateDef = "dim var_Items,h"
	oG2antt.TemplateDef = var_Items
	oG2antt.TemplateDef = h
	oG2antt.Template = "var_Items.ItemBar(h,`K`,3) = `using exBarForeColor`"

	' var_Items.ItemBar(h,"K",4) = 18
	oG2antt.TemplateDef = "dim var_Items,h"
	oG2antt.TemplateDef = var_Items
	oG2antt.TemplateDef = h
	oG2antt.Template = "var_Items.ItemBar(h,`K`,4) = 18"

	' var_Items.ItemBar(h,"K",8) = 65280
	oG2antt.TemplateDef = "dim var_Items,h"
	oG2antt.TemplateDef = var_Items
	oG2antt.TemplateDef = h
	oG2antt.Template = "var_Items.ItemBar(h,`K`,8) = 65280"

oG2antt.EndUpdate()
|
|
1118
|
I have noticed that when scrolling horizontally the chart a tooltip shown. is it possible to actually do the scrolling without showing the tooltip
Dim oG2antt as P
Dim var_Chart as P
Dim var_Items as P

oG2antt = topparent:CONTROL_ACTIVEX1.activex
oG2antt.BeginUpdate()
oG2antt.Columns.Add("Tasks")
var_Chart = oG2antt.Chart
	var_Chart.FirstVisibleDate = {06/20/2005}
	var_Chart.AllowLinkBars = .t.
	var_Chart.LevelCount = 2
	' var_Chart.PaneWidth(.f.) = 48
	oG2antt.TemplateDef = "dim var_Chart"
	oG2antt.TemplateDef = var_Chart
	oG2antt.Template = "var_Chart.PaneWidth(0) = 48"

	var_Chart.ToolTip = ""
var_Items = oG2antt.Items
	var_Items.AddBar(var_Items.AddItem("Task 1"),"Task",{06/21/2005},{06/25/2005},"A")
	var_Items.AddBar(var_Items.AddItem("Task 2"),"Task",{06/28/2005},{07/02/2005},"B")
oG2antt.EndUpdate()
|
|
1117
|
How can I add a bar to be treated as a nonworking part like a "holidays" bar
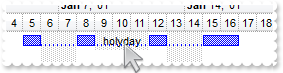
Dim h as N
Dim oG2antt as P
Dim var_Bar as local
Dim var_Chart as P
Dim var_Items as P

oG2antt = topparent:CONTROL_ACTIVEX1.activex
oG2antt.BeginUpdate()
var_Chart = oG2antt.Chart
	var_Chart.FirstVisibleDate = {01/01/2001}
	var_Chart.LevelCount = 2
	' var_Chart.PaneWidth(.f.) = 48
	oG2antt.TemplateDef = "dim var_Chart"
	oG2antt.TemplateDef = var_Chart
	oG2antt.Template = "var_Chart.PaneWidth(False) = 48"

	var_Chart.AllowNonworkingBars = .t.
	' var_Chart.Bars.Add("Task:Split").Shortcut = "Task"
	var_Bar = var_Chart.Bars.Add("Task:Split")
	oG2antt.TemplateDef = "dim var_Bar"
	oG2antt.TemplateDef = var_Bar
	oG2antt.Template = "var_Bar.Shortcut = `Task`"

oG2antt.Columns.Add("Tasks")
var_Items = oG2antt.Items
	h = var_Items.AddItem("Task 1")
	' var_Items.ItemNonworkingUnits(h,.f.) = "weekday(value) in (0,6)"
	oG2antt.TemplateDef = "dim var_Items,h"
	oG2antt.TemplateDef = var_Items
	oG2antt.TemplateDef = h
	oG2antt.Template = "var_Items.ItemNonworkingUnits(h,False) = `weekday(value) in (0,6)`"

	var_Items.AddBar(h,"",{01/02/2001},{01/05/2001},"A","holyday")
	' var_Items.ItemBar(h,"A",38) = .t.
	oG2antt.TemplateDef = "dim var_Items,h"
	oG2antt.TemplateDef = var_Items
	oG2antt.TemplateDef = h
	oG2antt.Template = "var_Items.ItemBar(h,`A`,38) = True"

	var_Items.AddBar(h,"Task",{01/05/2001},{01/12/2001},"Z")
	' var_Items.ItemBar(h,"Z",20) = .t.
	oG2antt.TemplateDef = "dim var_Items,h"
	oG2antt.TemplateDef = var_Items
	oG2antt.TemplateDef = h
	oG2antt.Template = "var_Items.ItemBar(h,`Z`,20) = True"

oG2antt.EndUpdate()
|
|
1116
|
Is it possible to add bars that act like a non-working fixed part or the item
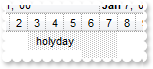
Dim h as N
Dim oG2antt as P
Dim var_Chart as P
Dim var_Items as P

oG2antt = topparent:CONTROL_ACTIVEX1.activex
oG2antt.BeginUpdate()
var_Chart = oG2antt.Chart
	var_Chart.FirstVisibleDate = {01/01/2001}
	var_Chart.LevelCount = 2
	' var_Chart.PaneWidth(.f.) = 48
	oG2antt.TemplateDef = "dim var_Chart"
	oG2antt.TemplateDef = var_Chart
	oG2antt.Template = "var_Chart.PaneWidth(False) = 48"

	var_Chart.AllowNonworkingBars = .t.
oG2antt.Columns.Add("Tasks")
var_Items = oG2antt.Items
	h = var_Items.AddItem("Task 1")
	' var_Items.ItemNonworkingUnits(h,.f.) = "weekday(value) in (0,6)"
	oG2antt.TemplateDef = "dim var_Items,h"
	oG2antt.TemplateDef = var_Items
	oG2antt.TemplateDef = h
	oG2antt.Template = "var_Items.ItemNonworkingUnits(h,False) = `weekday(value) in (0,6)`"

	var_Items.AddBar(h,"",{01/03/2001},{01/06/2001},"h","holyday")
	' var_Items.ItemBar(h,"h",38) = .t.
	oG2antt.TemplateDef = "dim var_Items,h"
	oG2antt.TemplateDef = var_Items
	oG2antt.TemplateDef = h
	oG2antt.Template = "var_Items.ItemBar(h,`h`,38) = True"

	' var_Items.ItemBar(h,"h",29) = .f.
	oG2antt.TemplateDef = "dim var_Items,h"
	oG2antt.TemplateDef = var_Items
	oG2antt.TemplateDef = h
	oG2antt.Template = "var_Items.ItemBar(h,`h`,29) = False"

oG2antt.EndUpdate()
|
|
1115
|
Is it possible to add bars that act like a non-working part or the item
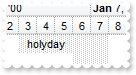
Dim h as N
Dim oG2antt as P
Dim var_Chart as P
Dim var_Items as P

oG2antt = topparent:CONTROL_ACTIVEX1.activex
oG2antt.BeginUpdate()
var_Chart = oG2antt.Chart
	var_Chart.FirstVisibleDate = {01/01/2001}
	var_Chart.LevelCount = 2
	' var_Chart.PaneWidth(.f.) = 48
	oG2antt.TemplateDef = "dim var_Chart"
	oG2antt.TemplateDef = var_Chart
	oG2antt.Template = "var_Chart.PaneWidth(False) = 48"

	var_Chart.AllowNonworkingBars = .t.
oG2antt.Columns.Add("Tasks")
var_Items = oG2antt.Items
	h = var_Items.AddItem("Task 1")
	' var_Items.ItemNonworkingUnits(h,.f.) = "weekday(value) in (0,6)"
	oG2antt.TemplateDef = "dim var_Items,h"
	oG2antt.TemplateDef = var_Items
	oG2antt.TemplateDef = h
	oG2antt.Template = "var_Items.ItemNonworkingUnits(h,False) = `weekday(value) in (0,6)`"

	var_Items.AddBar(h,"",{01/03/2001},{01/06/2001},"h","holyday")
	' var_Items.ItemBar(h,"h",38) = .t.
	oG2antt.TemplateDef = "dim var_Items,h"
	oG2antt.TemplateDef = var_Items
	oG2antt.TemplateDef = h
	oG2antt.Template = "var_Items.ItemBar(h,`h`,38) = True"

oG2antt.EndUpdate()
|
|
1114
|
How can I change the both dates for the bar at once
Dim h as N
Dim oG2antt as P
Dim var_Chart as P
Dim var_Items as P

oG2antt = topparent:CONTROL_ACTIVEX1.activex
oG2antt.BeginUpdate()
oG2antt.Columns.Add("Tasks")
var_Chart = oG2antt.Chart
	' var_Chart.PaneWidth(.f.) = 64
	oG2antt.TemplateDef = "dim var_Chart"
	oG2antt.TemplateDef = var_Chart
	oG2antt.Template = "var_Chart.PaneWidth(0) = 64"

	var_Chart.FirstVisibleDate = {06/21/2005}
	var_Chart.ShowEmptyBars = 1
var_Items = oG2antt.Items
	h = var_Items.AddItem("Test")
	var_Items.AddBar(h,"Task",{06/22/2005},{06/26/2005},"")
	var_Items.AddBar(h,"Task",{06/27/2005},{06/29/2005})
oG2antt.EndUpdate()
|
|
1113
|
How can I get the selected bars in the chart
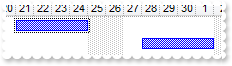
' Occurs when the user selects objects in the chart area.
function ChartSelectionChanged as v ()
	oG2antt = topparent:CONTROL_ACTIVEX1.activex
	? oG2antt.Items.SelectedObjects(1)
end function

Dim oG2antt as P
Dim var_Chart as P
Dim var_Items as P

oG2antt = topparent:CONTROL_ACTIVEX1.activex
oG2antt.BeginUpdate()
oG2antt.Columns.Add("Tasks")
var_Chart = oG2antt.Chart
	var_Chart.FirstVisibleDate = {06/20/2005}
	var_Chart.AllowLinkBars = .t.
	var_Chart.LevelCount = 2
	' var_Chart.PaneWidth(.f.) = 48
	oG2antt.TemplateDef = "dim var_Chart"
	oG2antt.TemplateDef = var_Chart
	oG2antt.Template = "var_Chart.PaneWidth(0) = 48"

var_Items = oG2antt.Items
	var_Items.AddBar(var_Items.AddItem("Task 1"),"Task",{06/21/2005},{06/25/2005},"A")
	var_Items.AddBar(var_Items.AddItem("Task 2"),"Task",{06/28/2005},{07/02/2005},"B")
	' var_Items.ItemBar(var_Items.FirstVisibleItem,var_Items.FirstItemBar(var_Items.FirstVisibleItem),257) = .t.
	oG2antt.TemplateDef = "dim var_Items"
	oG2antt.TemplateDef = var_Items
	oG2antt.Template = "var_Items.ItemBar(FirstVisibleItem,FirstItemBar(FirstVisibleItem),257) = True"

oG2antt.EndUpdate()
|
|
1112
|
How can I list the actions that can be performed by undo operations
' Occurs after the chart has been changed.
function ChartEndChanging as v (Operation  as  OLE::Exontrol.G2antt.1::BarOperationEnum)
	oG2antt = topparent:CONTROL_ACTIVEX1.activex
	? oG2antt.Chart.UndoListAction()
end function

Dim h as N
Dim oG2antt as P
Dim var_Bar as local
Dim var_Chart as local
Dim var_Items as P

oG2antt = topparent:CONTROL_ACTIVEX1.activex
oG2antt.BeginUpdate()
oG2antt.Chart.FirstVisibleDate = {01/01/2001}
oG2antt.Chart.AllowLinkBars = .f.
oG2antt.Chart.Bars.Item("Task").OverlaidType = 257 'exOverlaidBarsTransparent + exOverlaidBarsOffset
oG2antt.Chart.AllowUndoRedo = .t.
' oG2antt.Chart.PaneWidth(.f.) = 32
var_Chart = oG2antt.Chart
oG2antt.TemplateDef = "dim var_Chart"
oG2antt.TemplateDef = var_Chart
oG2antt.Template = "var_Chart.PaneWidth(False) = 32"

' oG2antt.Chart.Bars.Add("Task:Split").Shortcut = "Task"
var_Bar = oG2antt.Chart.Bars.Add("Task:Split")
oG2antt.TemplateDef = "dim var_Bar"
oG2antt.TemplateDef = var_Bar
oG2antt.Template = "var_Bar.Shortcut = `Task`"

oG2antt.Columns.Add("Column")
var_Items = oG2antt.Items
	var_Items.AddBar(var_Items.AddItem("Item 1"),"Task",{01/02/2001},{01/04/2001},"A")
	h = var_Items.AddItem("Item 2")
	var_Items.AddBar(h,"Task",{01/05/2001},{01/09/2001},"B")
	' var_Items.ItemBar(h,"B",28) = .t.
	oG2antt.TemplateDef = "dim var_Items,h"
	oG2antt.TemplateDef = var_Items
	oG2antt.TemplateDef = h
	oG2antt.Template = "var_Items.ItemBar(h,`B`,28) = True"

	' var_Items.ItemBar(h,"B",20) = .t.
	oG2antt.TemplateDef = "dim var_Items,h"
	oG2antt.TemplateDef = var_Items
	oG2antt.TemplateDef = h
	oG2antt.Template = "var_Items.ItemBar(h,`B`,20) = True"

	' var_Items.ItemNonworkingUnits(var_Items.AddItem("Item 3"),.f.) = "weekday(value)=0"
	oG2antt.TemplateDef = "dim var_Items"
	oG2antt.TemplateDef = var_Items
	oG2antt.Template = "var_Items.ItemNonworkingUnits(AddItem(`Item 3`),False) = `weekday(value)=0`"

	' var_Items.ItemNonworkingUnits(var_Items.AddItem("Item 4"),.f.) = "weekday(value) in (3,5)"
	oG2antt.TemplateDef = "dim var_Items"
	oG2antt.TemplateDef = var_Items
	oG2antt.Template = "var_Items.ItemNonworkingUnits(AddItem(`Item 4`),False) = `weekday(value) in (3,5)`"

oG2antt.EndUpdate()
|
|
1111
|
How can I change the predefined labels being displayed in the chart's header so it shows the data in short format with no literals
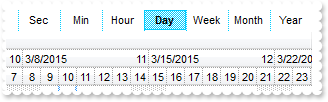
Dim oG2antt as P
Dim var_Chart as P

oG2antt = topparent:CONTROL_ACTIVEX1.activex
oG2antt.BeginUpdate()
var_Chart = oG2antt.Chart
	' var_Chart.PaneWidth(.f.) = 0
	oG2antt.TemplateDef = "dim var_Chart"
	oG2antt.TemplateDef = var_Chart
	oG2antt.Template = "var_Chart.PaneWidth(False) = 0"

	var_Chart.AllowOverviewZoom = 1
	var_Chart.OverviewVisible = 2
	var_Chart.LevelCount = 3
	' var_Chart.Label(0) = "<%yy%><|><%yyyy%>"
	oG2antt.TemplateDef = "dim var_Chart"
	oG2antt.TemplateDef = var_Chart
	oG2antt.Template = "var_Chart.Label(0) = `<%yy%><|><%yyyy%>`"

	' var_Chart.Label(1) = ""
	oG2antt.TemplateDef = "dim var_Chart"
	oG2antt.TemplateDef = var_Chart
	oG2antt.Template = "var_Chart.Label(1) = ``"

	' var_Chart.Label(2) = ""
	oG2antt.TemplateDef = "dim var_Chart"
	oG2antt.TemplateDef = var_Chart
	oG2antt.Template = "var_Chart.Label(2) = ``"

	' var_Chart.Label(16) = "<|><%m%><|><%m%>/<%yy%><|><%m%>/<%yyyy%>"
	oG2antt.TemplateDef = "dim var_Chart"
	oG2antt.TemplateDef = var_Chart
	oG2antt.Template = "var_Chart.Label(16) = `<|><%m%><|><%m%>/<%yy%><|><%m%>/<%yyyy%>`"

	' var_Chart.Label(17) = ""
	oG2antt.TemplateDef = "dim var_Chart"
	oG2antt.TemplateDef = var_Chart
	oG2antt.Template = "var_Chart.Label(17) = ``"

	' var_Chart.Label(256) = "<|><%ww%><|><%m%>/<%d%>/<%yy%><r><%ww%><|><%m%>/<%d%>/<%yyyy%><r><%ww%><||><||>256"
	oG2antt.TemplateDef = "dim var_Chart"
	oG2antt.TemplateDef = var_Chart
	oG2antt.Template = "var_Chart.Label(256) = `<|><%ww%><|><%m%>/<%d%>/<%yy%><r><%ww%><|><%m%>/<%d%>/<%yyyy%><r><%ww%><||><||>256`"

	' var_Chart.Label(4096) = "<|><%d%><|><%m%>/<%d%>/<%yy%><|><%m%>/<%d%>/<%yyyy%><||><||>4096"
	oG2antt.TemplateDef = "dim var_Chart"
	oG2antt.TemplateDef = var_Chart
	oG2antt.Template = "var_Chart.Label(4096) = `<|><%d%><|><%m%>/<%d%>/<%yy%><|><%m%>/<%d%>/<%yyyy%><||><||>4096`"

	' var_Chart.Label(65536) = "<|><%hh%><|><%m%>/<%d%>/<%yy%> <%h%> <%AM/PM%><|><%m%>/<%d%>/<%yyyy%> <%h%> <%AM/PM%><||><||>65536"
	oG2antt.TemplateDef = "dim var_Chart"
	oG2antt.TemplateDef = var_Chart
	oG2antt.Template = "var_Chart.Label(65536) = `<|><%hh%><|><%m%>/<%d%>/<%yy%> <%h%> <%AM/PM%><|><%m%>/<%d%>/<%yyyy%> <%h%> <%AM/PM%><||><||>65536`"

	' var_Chart.Label(1048576) = "<|><%nn%><|><%h%>:<%nn% <%AM/PM%>><|><%m%>/<%d%>/<%yy%> <%h%>:<%nn%> <%AM/PM%><|><%m%>/<%d%>/<%yyyy%> <%h%>:<%nn%> <%AM/PM%>"
	oG2antt.TemplateDef = "dim var_Chart"
	oG2antt.TemplateDef = var_Chart
	oG2antt.Template = "var_Chart.Label(1048576) = `<|><%nn%><|><%h%>:<%nn% <%AM/PM%>><|><%m%>/<%d%>/<%yy%> <%h%>:<%nn%> <%AM/PM%><|><%m%>/<%d%>/<%yyyy%> <%h%>:<%nn%> <%AM/PM%>`"

	' var_Chart.Label(16777216) = "<|><%ss%><|><%nn%>:<%ss%><|><%h%>:<%nn%>:<%ss%> <%AM/PM%><|><%m%>/<%d%>/<%yy%> <%h%>:<%nn%>:<%ss%> <%AM/PM%><|><%m%>/<%d%>/<%yyyy%> <%h%>:<%nn%>:<%ss%> <%AM/PM%>"
	oG2antt.TemplateDef = "dim var_Chart"
	oG2antt.TemplateDef = var_Chart
	oG2antt.Template = "var_Chart.Label(16777216) = `<|><%ss%><|><%nn%>:<%ss%><|><%h%>:<%nn%>:<%ss%> <%AM/PM%><|><%m%>/<%d%>/<%yy%> <%h%>:<%nn%>:<%ss%> <%AM/PM%><|><%m%>/<%d%>/<%yyyy%> <%h%>:<%nn%>:<%ss%> <%AM/PM%>`"

	' var_Chart.LabelToolTip(0) = "<%yyyy%>"
	oG2antt.TemplateDef = "dim var_Chart"
	oG2antt.TemplateDef = var_Chart
	oG2antt.Template = "var_Chart.LabelToolTip(0) = `<%yyyy%>`"

	' var_Chart.LabelToolTip(1) = ""
	oG2antt.TemplateDef = "dim var_Chart"
	oG2antt.TemplateDef = var_Chart
	oG2antt.Template = "var_Chart.LabelToolTip(1) = ``"

	' var_Chart.LabelToolTip(2) = ""
	oG2antt.TemplateDef = "dim var_Chart"
	oG2antt.TemplateDef = var_Chart
	oG2antt.Template = "var_Chart.LabelToolTip(2) = ``"

	' var_Chart.LabelToolTip(16) = "<%m%>/<%yyyy%>"
	oG2antt.TemplateDef = "dim var_Chart"
	oG2antt.TemplateDef = var_Chart
	oG2antt.Template = "var_Chart.LabelToolTip(16) = `<%m%>/<%yyyy%>`"

	' var_Chart.LabelToolTip(17) = ""
	oG2antt.TemplateDef = "dim var_Chart"
	oG2antt.TemplateDef = var_Chart
	oG2antt.Template = "var_Chart.LabelToolTip(17) = ``"

	' var_Chart.LabelToolTip(256) = "<%m%>/<%d%>/<%yyyy%> <%ww%>"
	oG2antt.TemplateDef = "dim var_Chart"
	oG2antt.TemplateDef = var_Chart
	oG2antt.Template = "var_Chart.LabelToolTip(256) = `<%m%>/<%d%>/<%yyyy%> <%ww%>`"

	' var_Chart.LabelToolTip(4096) = "<%m%>/<%d%>/<%yyyy%>"
	oG2antt.TemplateDef = "dim var_Chart"
	oG2antt.TemplateDef = var_Chart
	oG2antt.Template = "var_Chart.LabelToolTip(4096) = `<%m%>/<%d%>/<%yyyy%>`"

	' var_Chart.LabelToolTip(65536) = "<%m%>/<%d%>/<%yyyy%> <%h%> <%AM/PM%>"
	oG2antt.TemplateDef = "dim var_Chart"
	oG2antt.TemplateDef = var_Chart
	oG2antt.Template = "var_Chart.LabelToolTip(65536) = `<%m%>/<%d%>/<%yyyy%> <%h%> <%AM/PM%>`"

	' var_Chart.LabelToolTip(1048576) = "<%m%>/<%d%>/<%yyyy%> <%h%>:<%nn%> <%AM/PM%>"
	oG2antt.TemplateDef = "dim var_Chart"
	oG2antt.TemplateDef = var_Chart
	oG2antt.Template = "var_Chart.LabelToolTip(1048576) = `<%m%>/<%d%>/<%yyyy%> <%h%>:<%nn%> <%AM/PM%>`"

	' var_Chart.LabelToolTip(16777216) = "<%m%>/<%d%>/<%yyyy%> <%h%>:<%nn%>:<%ss%> <%AM/PM%>"
	oG2antt.TemplateDef = "dim var_Chart"
	oG2antt.TemplateDef = var_Chart
	oG2antt.Template = "var_Chart.LabelToolTip(16777216) = `<%m%>/<%d%>/<%yyyy%> <%h%>:<%nn%>:<%ss%> <%AM/PM%>`"

	var_Chart.UnitScale = 4096
oG2antt.EndUpdate()
|
|
1110
|
The histogram does not show (correctly) the bars, even if I changed the Bar.HistogramPattern and Bar.HistogramColor properties. What can be wrong
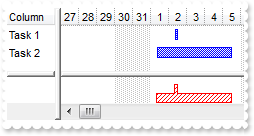
Dim oG2antt as P
Dim var_Bar as P
Dim var_Chart as P
Dim var_Items as P

oG2antt = topparent:CONTROL_ACTIVEX1.activex
oG2antt.BeginUpdate()
var_Chart = oG2antt.Chart
	' var_Chart.PaneWidth(.f.) = 48
	oG2antt.TemplateDef = "dim var_Chart"
	oG2antt.TemplateDef = var_Chart
	oG2antt.Template = "var_Chart.PaneWidth(False) = 48"

	var_Chart.FirstVisibleDate = {12/27/2000}
	var_Chart.HistogramVisible = .t.
	var_Chart.HistogramHeight = 32
	var_Bar = var_Chart.Bars.Item("Task")
		var_Bar.HistogramPattern = 6
		var_Bar.HistogramColor = 255
	var_Chart.ResizeUnitScale = 65536
oG2antt.Columns.Add("Column")
var_Items = oG2antt.Items
	var_Items.AddBar(var_Items.AddItem("Task 1"),"Task",{01/02/2001 08:00:00},{01/02/2001 12:00:00})
	var_Items.AddBar(var_Items.AddItem("Task 2"),"Task",{01/01/2001 08:00:00},{01/05/2001 12:00:00})
oG2antt.EndUpdate()
|
|
1109
|
How can I change the default key for the newly added link from "Link1" to my identifier
' Occurs when the user links two bars using the mouse.
function AddLink as v (LinkKey  as  C)
	Dim var_Items as P
	oG2antt = topparent:CONTROL_ACTIVEX1.activex
	var_Items = oG2antt.Items
		var_Items.AddLink("newIDlink",var_Items.Link(LinkKey,0),var_Items.Link(LinkKey,1),var_Items.Link(LinkKey,2),var_Items.Link(LinkKey,3))
		var_Items.RemoveLink(LinkKey)
end function

' Occurs when the user moves the mouse.
function MouseMove as v (Button  as  N, Shift  as  N, X  as  OLE::Exontrol.G2antt.1::OLE_XPOS_PIXELS, Y  as  OLE::Exontrol.G2antt.1::OLE_YPOS_PIXELS)
	oG2antt = topparent:CONTROL_ACTIVEX1.activex
	? oG2antt.Chart.LinkFromPoint(-1,-1)
end function

Dim oG2antt as P
Dim var_Chart as P
Dim var_Items as P

oG2antt = topparent:CONTROL_ACTIVEX1.activex
oG2antt.BeginUpdate()
oG2antt.Columns.Add("Tasks")
var_Chart = oG2antt.Chart
	var_Chart.FirstVisibleDate = {06/20/2005}
	var_Chart.AllowLinkBars = .t.
	var_Chart.LevelCount = 2
	' var_Chart.PaneWidth(.f.) = 48
	oG2antt.TemplateDef = "dim var_Chart"
	oG2antt.TemplateDef = var_Chart
	oG2antt.Template = "var_Chart.PaneWidth(0) = 48"

var_Items = oG2antt.Items
	var_Items.AddBar(var_Items.AddItem("Task 1"),"Task",{06/21/2005},{06/25/2005},"")
	var_Items.AddBar(var_Items.AddItem("Task 2"),"Task",{06/28/2005},{07/02/2005},"")
oG2antt.EndUpdate()
|
|
1108
|
How can I change the default key for the newly added link from "Link1" to my identifier
' Notifies at runtime when a link between two bars is possible.
function AllowLink as v (StartItem  as  OLE::Exontrol.G2antt.1::HITEM, StartBarKey  as  A, EndItem  as  OLE::Exontrol.G2antt.1::HITEM, EndBarKey  as  A, LinkKey  as  A, Cancel  as  L)
	oG2antt = topparent:CONTROL_ACTIVEX1.activex
	LinkKey = "newIDlink"
end function

' Occurs when the user moves the mouse.
function MouseMove as v (Button  as  N, Shift  as  N, X  as  OLE::Exontrol.G2antt.1::OLE_XPOS_PIXELS, Y  as  OLE::Exontrol.G2antt.1::OLE_YPOS_PIXELS)
	oG2antt = topparent:CONTROL_ACTIVEX1.activex
	? oG2antt.Chart.LinkFromPoint(-1,-1)
end function

Dim oG2antt as P
Dim var_Chart as P
Dim var_Items as P

oG2antt = topparent:CONTROL_ACTIVEX1.activex
oG2antt.BeginUpdate()
oG2antt.Columns.Add("Tasks")
var_Chart = oG2antt.Chart
	var_Chart.FirstVisibleDate = {06/20/2005}
	var_Chart.AllowLinkBars = .t.
	var_Chart.LevelCount = 2
	' var_Chart.PaneWidth(.f.) = 48
	oG2antt.TemplateDef = "dim var_Chart"
	oG2antt.TemplateDef = var_Chart
	oG2antt.Template = "var_Chart.PaneWidth(0) = 48"

var_Items = oG2antt.Items
	var_Items.AddBar(var_Items.AddItem("Task 1"),"Task",{06/21/2005},{06/25/2005},"")
	var_Items.AddBar(var_Items.AddItem("Task 2"),"Task",{06/28/2005},{07/02/2005},"")
oG2antt.EndUpdate()
|
|
1107
|
We want to have a Task ID column as the first column that shows the row number. How can we do that
' Fired when a cell requires to format its caption.
function FormatColumn as v (Item  as  OLE::Exontrol.G2antt.1::HITEM, ColIndex  as  N, Value  as  A)
	oG2antt = topparent:CONTROL_ACTIVEX1.activex
	Value = oG2antt.Items.ItemPosition(Item)
end function

Dim oG2antt as P
Dim var_Column as P
Dim var_Items as P

oG2antt = topparent:CONTROL_ACTIVEX1.activex
oG2antt.BeginUpdate()
oG2antt.Columns.Add("Task")
var_Column = oG2antt.Columns.Add("Pos")
	var_Column.Width = 24
	var_Column.AllowSizing = .f.
	var_Column.Position = 0
	var_Column.FireFormatColumn = .t.
var_Items = oG2antt.Items
	var_Items.AddItem("Task A")
	var_Items.AddItem("Task B")
	var_Items.AddItem("Task C")
	var_Items.AddItem("Task D")
oG2antt.EndUpdate()
|
|
1106
|
How can I get the caption of focused item
' Fired after a new item has been selected.
function SelectionChanged as v ()
	Dim var_Items as P
	oG2antt = topparent:CONTROL_ACTIVEX1.activex
	var_Items = oG2antt.Items
		? "Handle"
		? var_Items.FocusItem
		? "Caption"
		? var_Items.CellCaption(var_Items.FocusItem,0)
end function

Dim h as N
Dim oG2antt as P
Dim var_Items as P

oG2antt = topparent:CONTROL_ACTIVEX1.activex
oG2antt.BeginUpdate()
oG2antt.LinesAtRoot = -1
oG2antt.Columns.Add("Items")
var_Items = oG2antt.Items
	h = var_Items.AddItem("R1")
	var_Items.InsertItem(h,,"Cell 1.1")
	var_Items.InsertItem(h,,"Cell 1.2")
	' var_Items.ExpandItem(h) = .t.
	oG2antt.TemplateDef = "dim var_Items,h"
	oG2antt.TemplateDef = var_Items
	oG2antt.TemplateDef = h
	oG2antt.Template = "var_Items.ExpandItem(h) = True"

	h = var_Items.AddItem("R2")
	var_Items.InsertItem(h,,"Cell 2.1")
	var_Items.InsertItem(h,,"Cell 2.2")
	' var_Items.ExpandItem(h) = .t.
	oG2antt.TemplateDef = "dim var_Items,h"
	oG2antt.TemplateDef = var_Items
	oG2antt.TemplateDef = h
	oG2antt.Template = "var_Items.ExpandItem(h) = True"

oG2antt.EndUpdate()
|
|
1105
|
How can I get the caption of selected item
' Fired after a new item has been selected.
function SelectionChanged as v ()
	Dim var_Items as P
	oG2antt = topparent:CONTROL_ACTIVEX1.activex
	var_Items = oG2antt.Items
		? "Handle"
		? var_Items.SelectedItem(0)
		? "Caption"
		? var_Items.CellCaption(var_Items.SelectedItem(0),0)
end function

Dim h as N
Dim oG2antt as P
Dim var_Items as P

oG2antt = topparent:CONTROL_ACTIVEX1.activex
oG2antt.BeginUpdate()
oG2antt.LinesAtRoot = -1
oG2antt.Columns.Add("Items")
var_Items = oG2antt.Items
	h = var_Items.AddItem("R1")
	var_Items.InsertItem(h,,"Cell 1.1")
	var_Items.InsertItem(h,,"Cell 1.2")
	' var_Items.ExpandItem(h) = .t.
	oG2antt.TemplateDef = "dim var_Items,h"
	oG2antt.TemplateDef = var_Items
	oG2antt.TemplateDef = h
	oG2antt.Template = "var_Items.ExpandItem(h) = True"

	h = var_Items.AddItem("R2")
	var_Items.InsertItem(h,,"Cell 2.1")
	var_Items.InsertItem(h,,"Cell 2.2")
	' var_Items.ExpandItem(h) = .t.
	oG2antt.TemplateDef = "dim var_Items,h"
	oG2antt.TemplateDef = var_Items
	oG2antt.TemplateDef = h
	oG2antt.Template = "var_Items.ExpandItem(h) = True"

oG2antt.EndUpdate()
|
|
1104
|
How can I get the link from the point
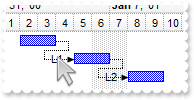
' Occurs when the user moves the mouse.
function MouseMove as v (Button  as  N, Shift  as  N, X  as  OLE::Exontrol.G2antt.1::OLE_XPOS_PIXELS, Y  as  OLE::Exontrol.G2antt.1::OLE_YPOS_PIXELS)
	oG2antt = topparent:CONTROL_ACTIVEX1.activex
	? oG2antt.Chart.LinkFromPoint(-1,-1)
end function

Dim h1 as N
Dim h2 as N
Dim h3 as N
Dim oG2antt as P
Dim var_Chart as P
Dim var_Items as P

oG2antt = topparent:CONTROL_ACTIVEX1.activex
oG2antt.BeginUpdate()
oG2antt.Columns.Add("Task")
var_Chart = oG2antt.Chart
	var_Chart.FirstVisibleDate = {12/29/2000}
	' var_Chart.PaneWidth(.f.) = 64
	oG2antt.TemplateDef = "dim var_Chart"
	oG2antt.TemplateDef = var_Chart
	oG2antt.Template = "var_Chart.PaneWidth(False) = 64"

	var_Chart.LevelCount = 2
var_Items = oG2antt.Items
	h1 = var_Items.AddItem("Task 1")
	var_Items.AddBar(h1,"Task",{01/02/2001},{01/04/2001},"K1")
	h2 = var_Items.AddItem("Task 2")
	var_Items.AddBar(h2,"Task",{01/05/2001},{01/07/2001},"K2")
	var_Items.AddLink("L1",h1,"K1",h2,"K2")
	' var_Items.Link("L1",12) = "L1"
	oG2antt.TemplateDef = "dim var_Items"
	oG2antt.TemplateDef = var_Items
	oG2antt.Template = "var_Items.Link(`L1`,12) = `L1`"

	h3 = var_Items.AddItem("Task 3")
	var_Items.AddBar(h3,"Task",{01/08/2001},{01/10/2001},"K3")
	var_Items.AddLink("L2",h2,"K2",h3,"K3")
	' var_Items.Link("L2",12) = "L2"
	oG2antt.TemplateDef = "dim var_Items"
	oG2antt.TemplateDef = var_Items
	oG2antt.Template = "var_Items.Link(`L2`,12) = `L2`"

oG2antt.EndUpdate()
|
|
1103
|
How can I get the bar from the point
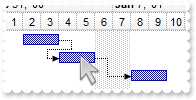
' Occurs when the user moves the mouse.
function MouseMove as v (Button  as  N, Shift  as  N, X  as  OLE::Exontrol.G2antt.1::OLE_XPOS_PIXELS, Y  as  OLE::Exontrol.G2antt.1::OLE_YPOS_PIXELS)
	oG2antt = topparent:CONTROL_ACTIVEX1.activex
	? oG2antt.Chart.BarFromPoint(-1,-1)
end function

Dim h1 as N
Dim h2 as N
Dim h3 as N
Dim oG2antt as P
Dim var_Chart as P
Dim var_Items as P

oG2antt = topparent:CONTROL_ACTIVEX1.activex
oG2antt.BeginUpdate()
oG2antt.Columns.Add("Task")
var_Chart = oG2antt.Chart
	var_Chart.FirstVisibleDate = {12/29/2000}
	' var_Chart.PaneWidth(.f.) = 64
	oG2antt.TemplateDef = "dim var_Chart"
	oG2antt.TemplateDef = var_Chart
	oG2antt.Template = "var_Chart.PaneWidth(False) = 64"

	var_Chart.LevelCount = 2
var_Items = oG2antt.Items
	h1 = var_Items.AddItem("Task 1")
	var_Items.AddBar(h1,"Task",{01/02/2001},{01/04/2001},"K1")
	h2 = var_Items.AddItem("Task 2")
	var_Items.AddBar(h2,"Task",{01/04/2001},{01/06/2001},"K2")
	var_Items.AddLink("L1",h1,"K1",h2,"K2")
	h3 = var_Items.AddItem("Task 3")
	var_Items.AddBar(h3,"Task",{01/08/2001},{01/10/2001},"K3")
	var_Items.AddLink("L2",h2,"K2",h3,"K3")
oG2antt.EndUpdate()
|
|
1102
|
How can I get the level from the cursor
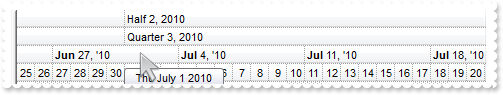
' Occurs when the user moves the mouse.
function MouseMove as v (Button  as  N, Shift  as  N, X  as  OLE::Exontrol.G2antt.1::OLE_XPOS_PIXELS, Y  as  OLE::Exontrol.G2antt.1::OLE_YPOS_PIXELS)
	oG2antt = topparent:CONTROL_ACTIVEX1.activex
	? oG2antt.Chart.LevelFromPoint(-1,-1)
end function

Dim oG2antt as P
Dim var_Chart as P

oG2antt = topparent:CONTROL_ACTIVEX1.activex
var_Chart = oG2antt.Chart
	var_Chart.FirstVisibleDate = {06/25/2010}
	' var_Chart.PaneWidth(.f.) = 0
	oG2antt.TemplateDef = "dim var_Chart"
	oG2antt.TemplateDef = var_Chart
	oG2antt.Template = "var_Chart.PaneWidth(False) = 0"

	var_Chart.LevelCount = 4
|
|
1101
|
How can I get the date from the cursor
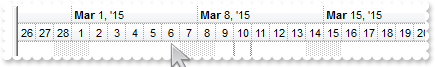
' Occurs when the user moves the mouse.
function MouseMove as v (Button  as  N, Shift  as  N, X  as  OLE::Exontrol.G2antt.1::OLE_XPOS_PIXELS, Y  as  OLE::Exontrol.G2antt.1::OLE_YPOS_PIXELS)
	oG2antt = topparent:CONTROL_ACTIVEX1.activex
	? oG2antt.Chart.DateFromPoint(-1,-1)
end function

Dim oG2antt as P
Dim var_Chart as P

oG2antt = topparent:CONTROL_ACTIVEX1.activex
var_Chart = oG2antt.Chart
	' var_Chart.PaneWidth(.f.) = 0
	oG2antt.TemplateDef = "dim var_Chart"
	oG2antt.TemplateDef = var_Chart
	oG2antt.Template = "var_Chart.PaneWidth(False) = 0"

	var_Chart.LevelCount = 2
|